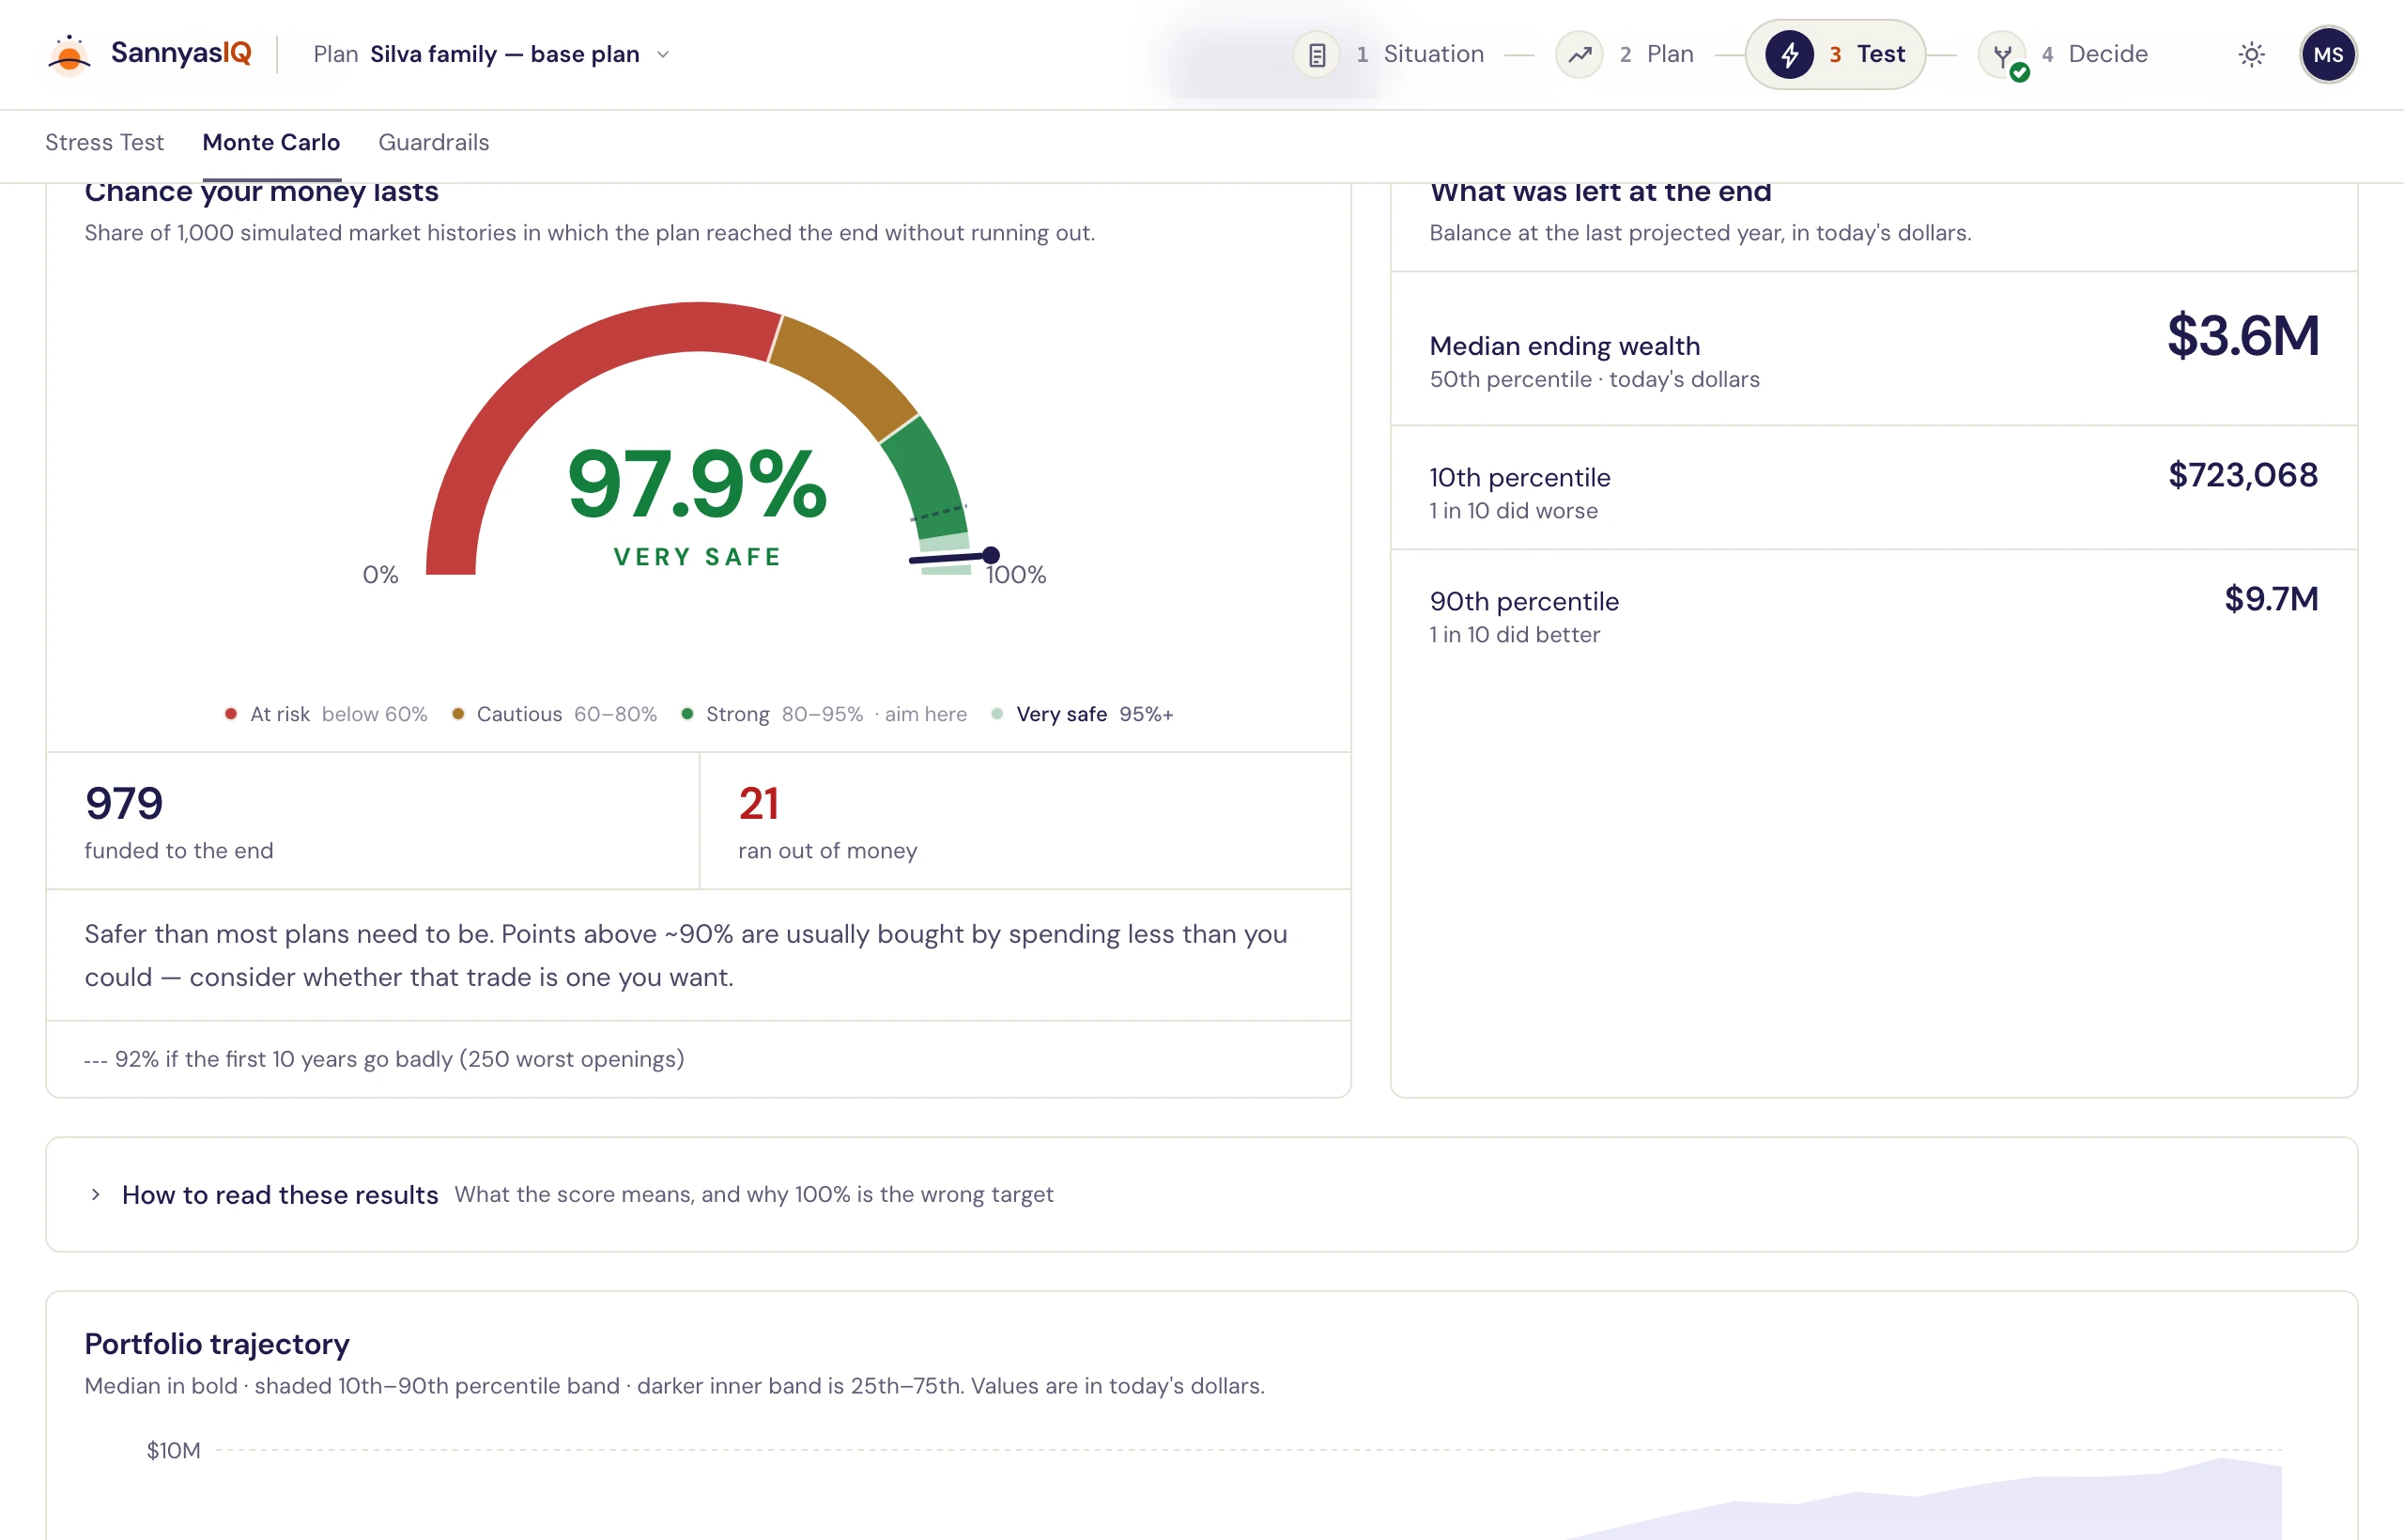
The year you can stop working — and the arithmetic behind it.
SannyasIQ projects both partners year by year to the end of the plan. Federal and state tax, ACA premium credits, IRMAA surcharges, required distributions and Social Security timing are part of the arithmetic here, not a footnote to it — and every figure says which year and which dollars it is in.
- No credit card
- Both partners modelled separately
- Every assumption editable
How it works
Four phases, in the order the work actually happens.
Not a wizard you finish and never see again. The four phases are the app's navigation, and you move between them for as long as the plan is alive — because you cannot stress-test a plan you have not built, and you cannot choose a drawdown order before you know what it has to fund.
- 01
Situation
Who you are and what you have
Both adults and any dependents, incomes and raises, every account with its own allocation and cost basis, property, debts, and spending split into needs and wants. Entered once, shared by every plan you build.
- 02
Plan
Build it and see what it does
Retirement ages, lifespans, returns, inflation and the per-category growth multipliers. The projection re-runs as you change them, four ways: balances by tax bucket, what funds each year, income against spending, and the year-by-year arithmetic behind all three.
- 03
Test
Try to break it
Move returns, inflation, spending and longevity against your own assumptions. Drop in a crash, a medical event, a long-term-care episode, or a real historical sequence. Then run up to 2,000 random-market trials and see how often the plan survives.
- 04
Decide
How to actually draw it down
Which account you spend from first is a tax decision. Choose an order, layer Roth conversions to the top of a bracket you pick, keep MAGI under the ACA cliff or an IRMAA tier, and override any single year by hand.
What you get
The spreadsheet you would have built, if you had three months.
One engine run, four ways to read it
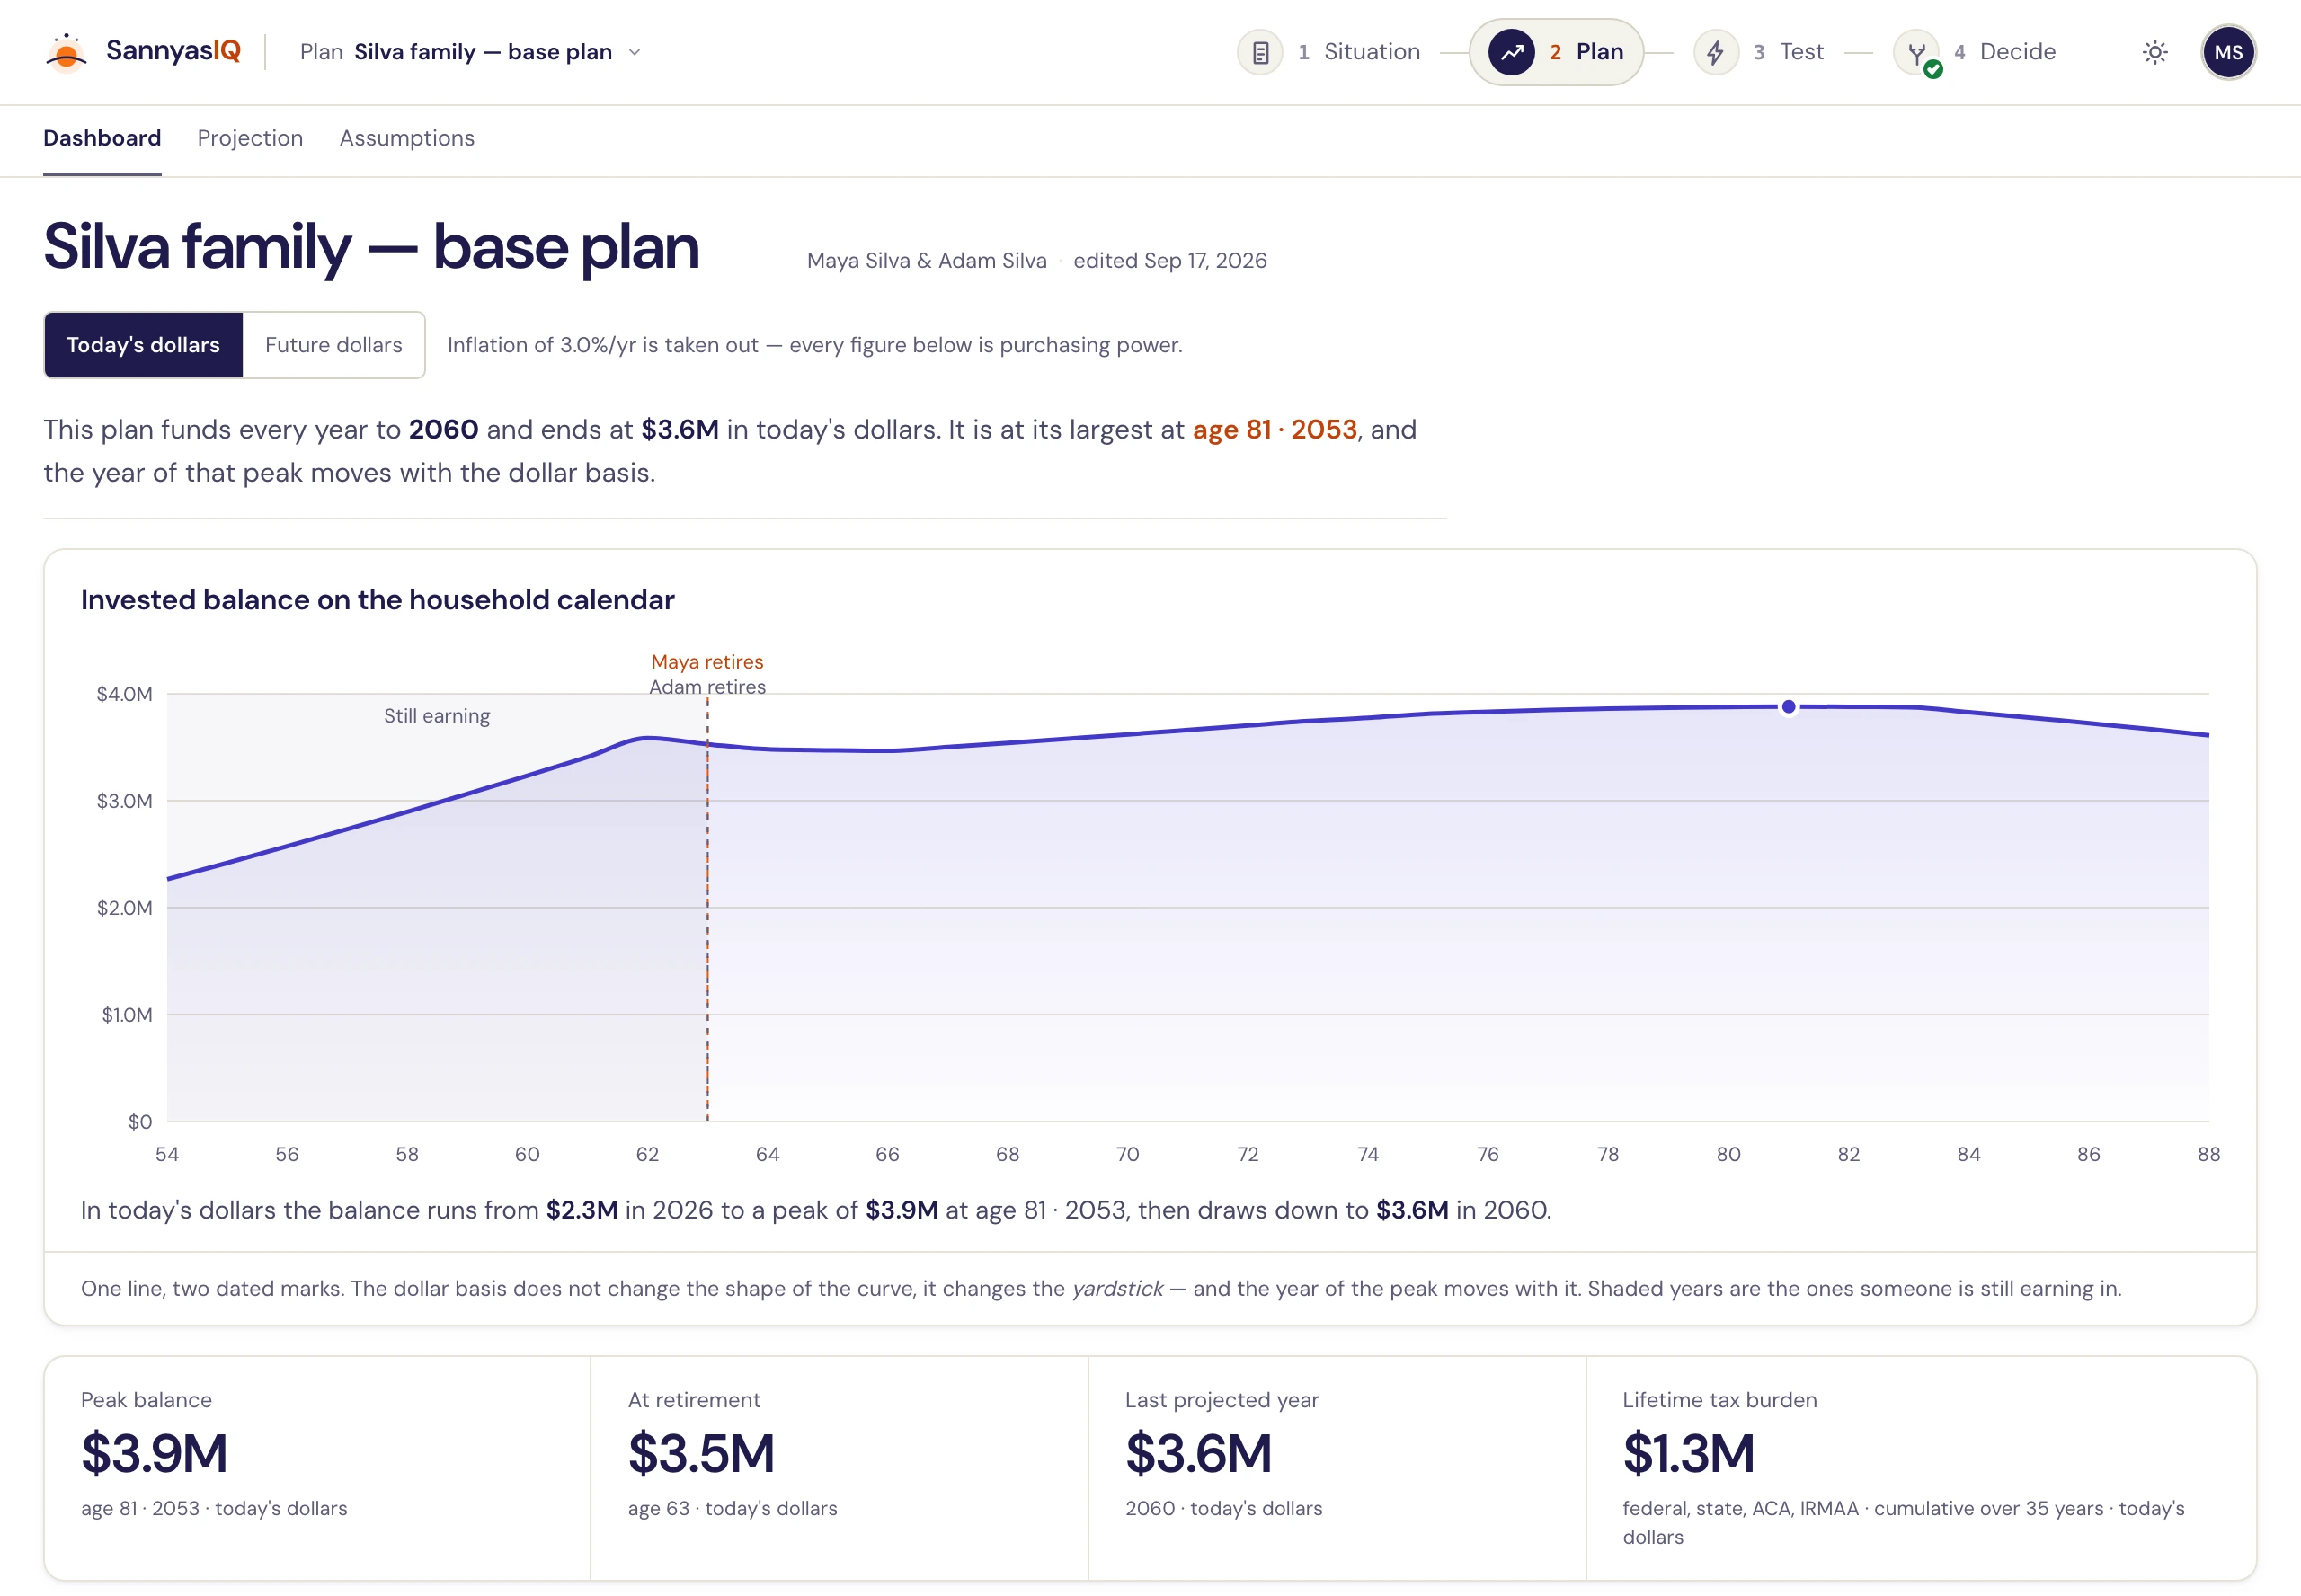
The full projection stacks closing balances by tax treatment — taxable, then tax-deferred, then tax-free — because that ordering is the withdrawal order, so the chart teaches the sequence without a legend. Beside it: what funds each retirement year, income against spending, and the year-by-year table the other three are drawn from.
The markers are yours. Each partner's retirement year, the year Social Security starts, the year RMDs begin — all placed from your plan, not from a default anyone else would get.
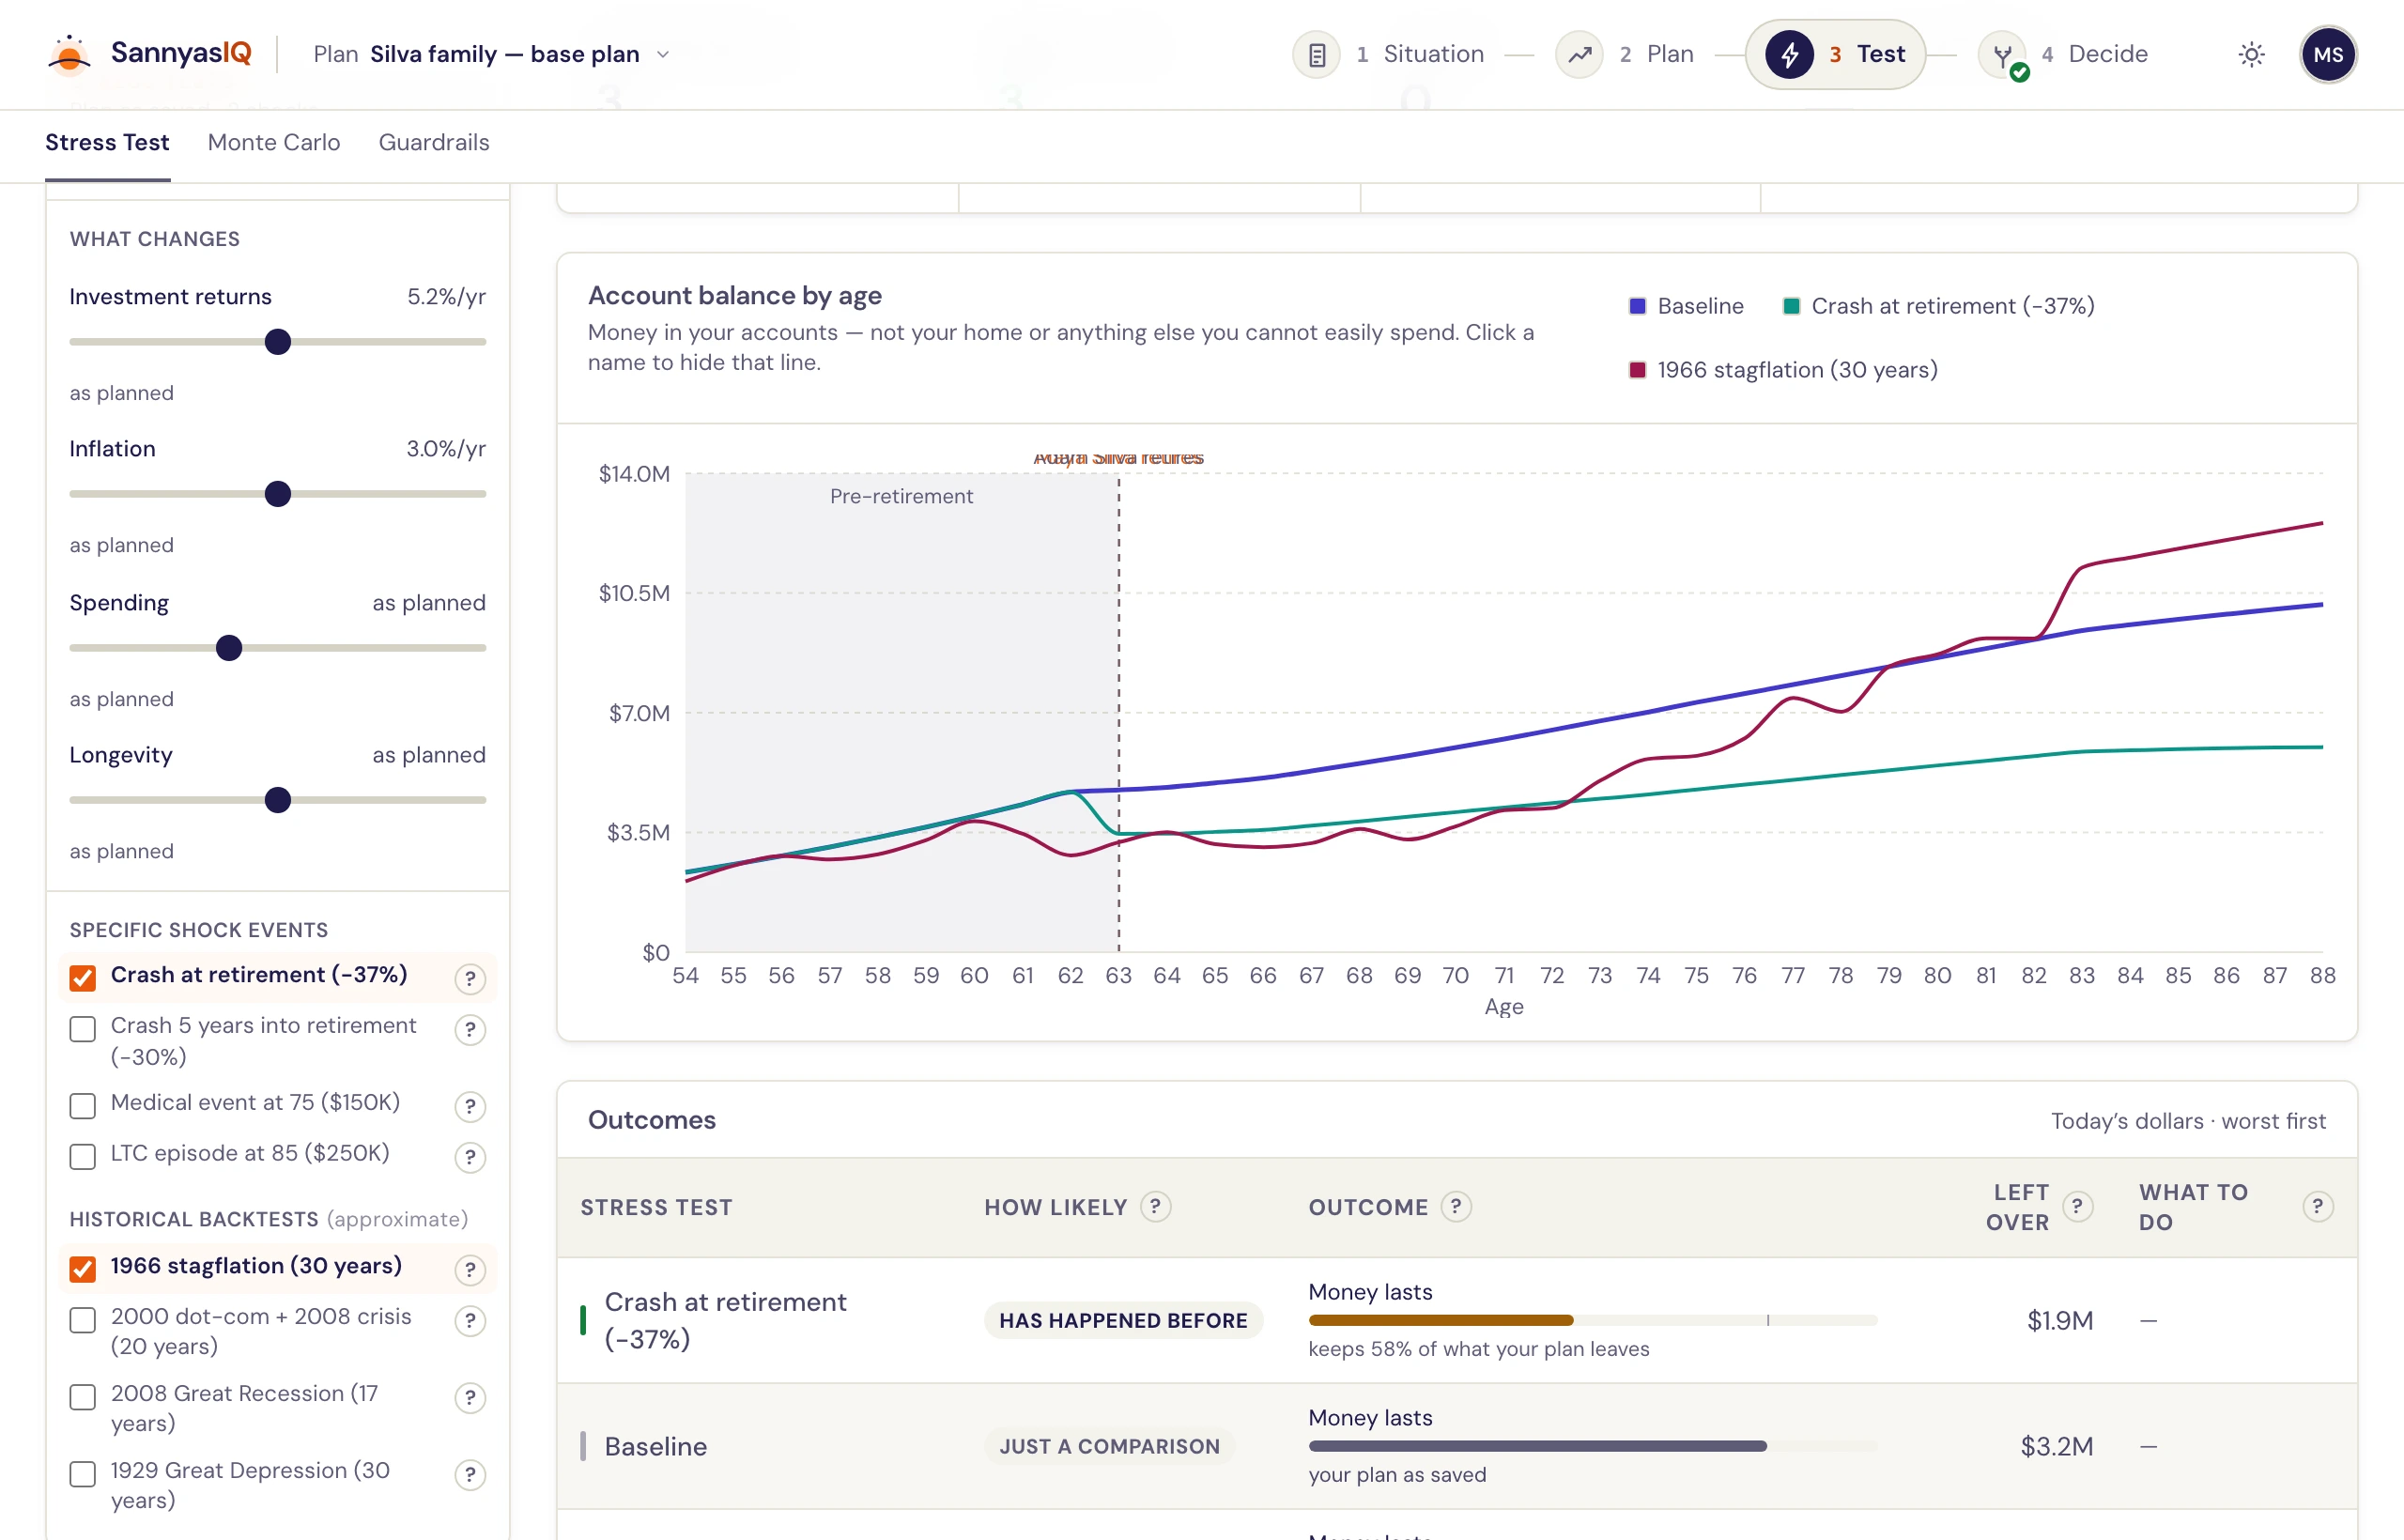
Turn the dials until it stops working
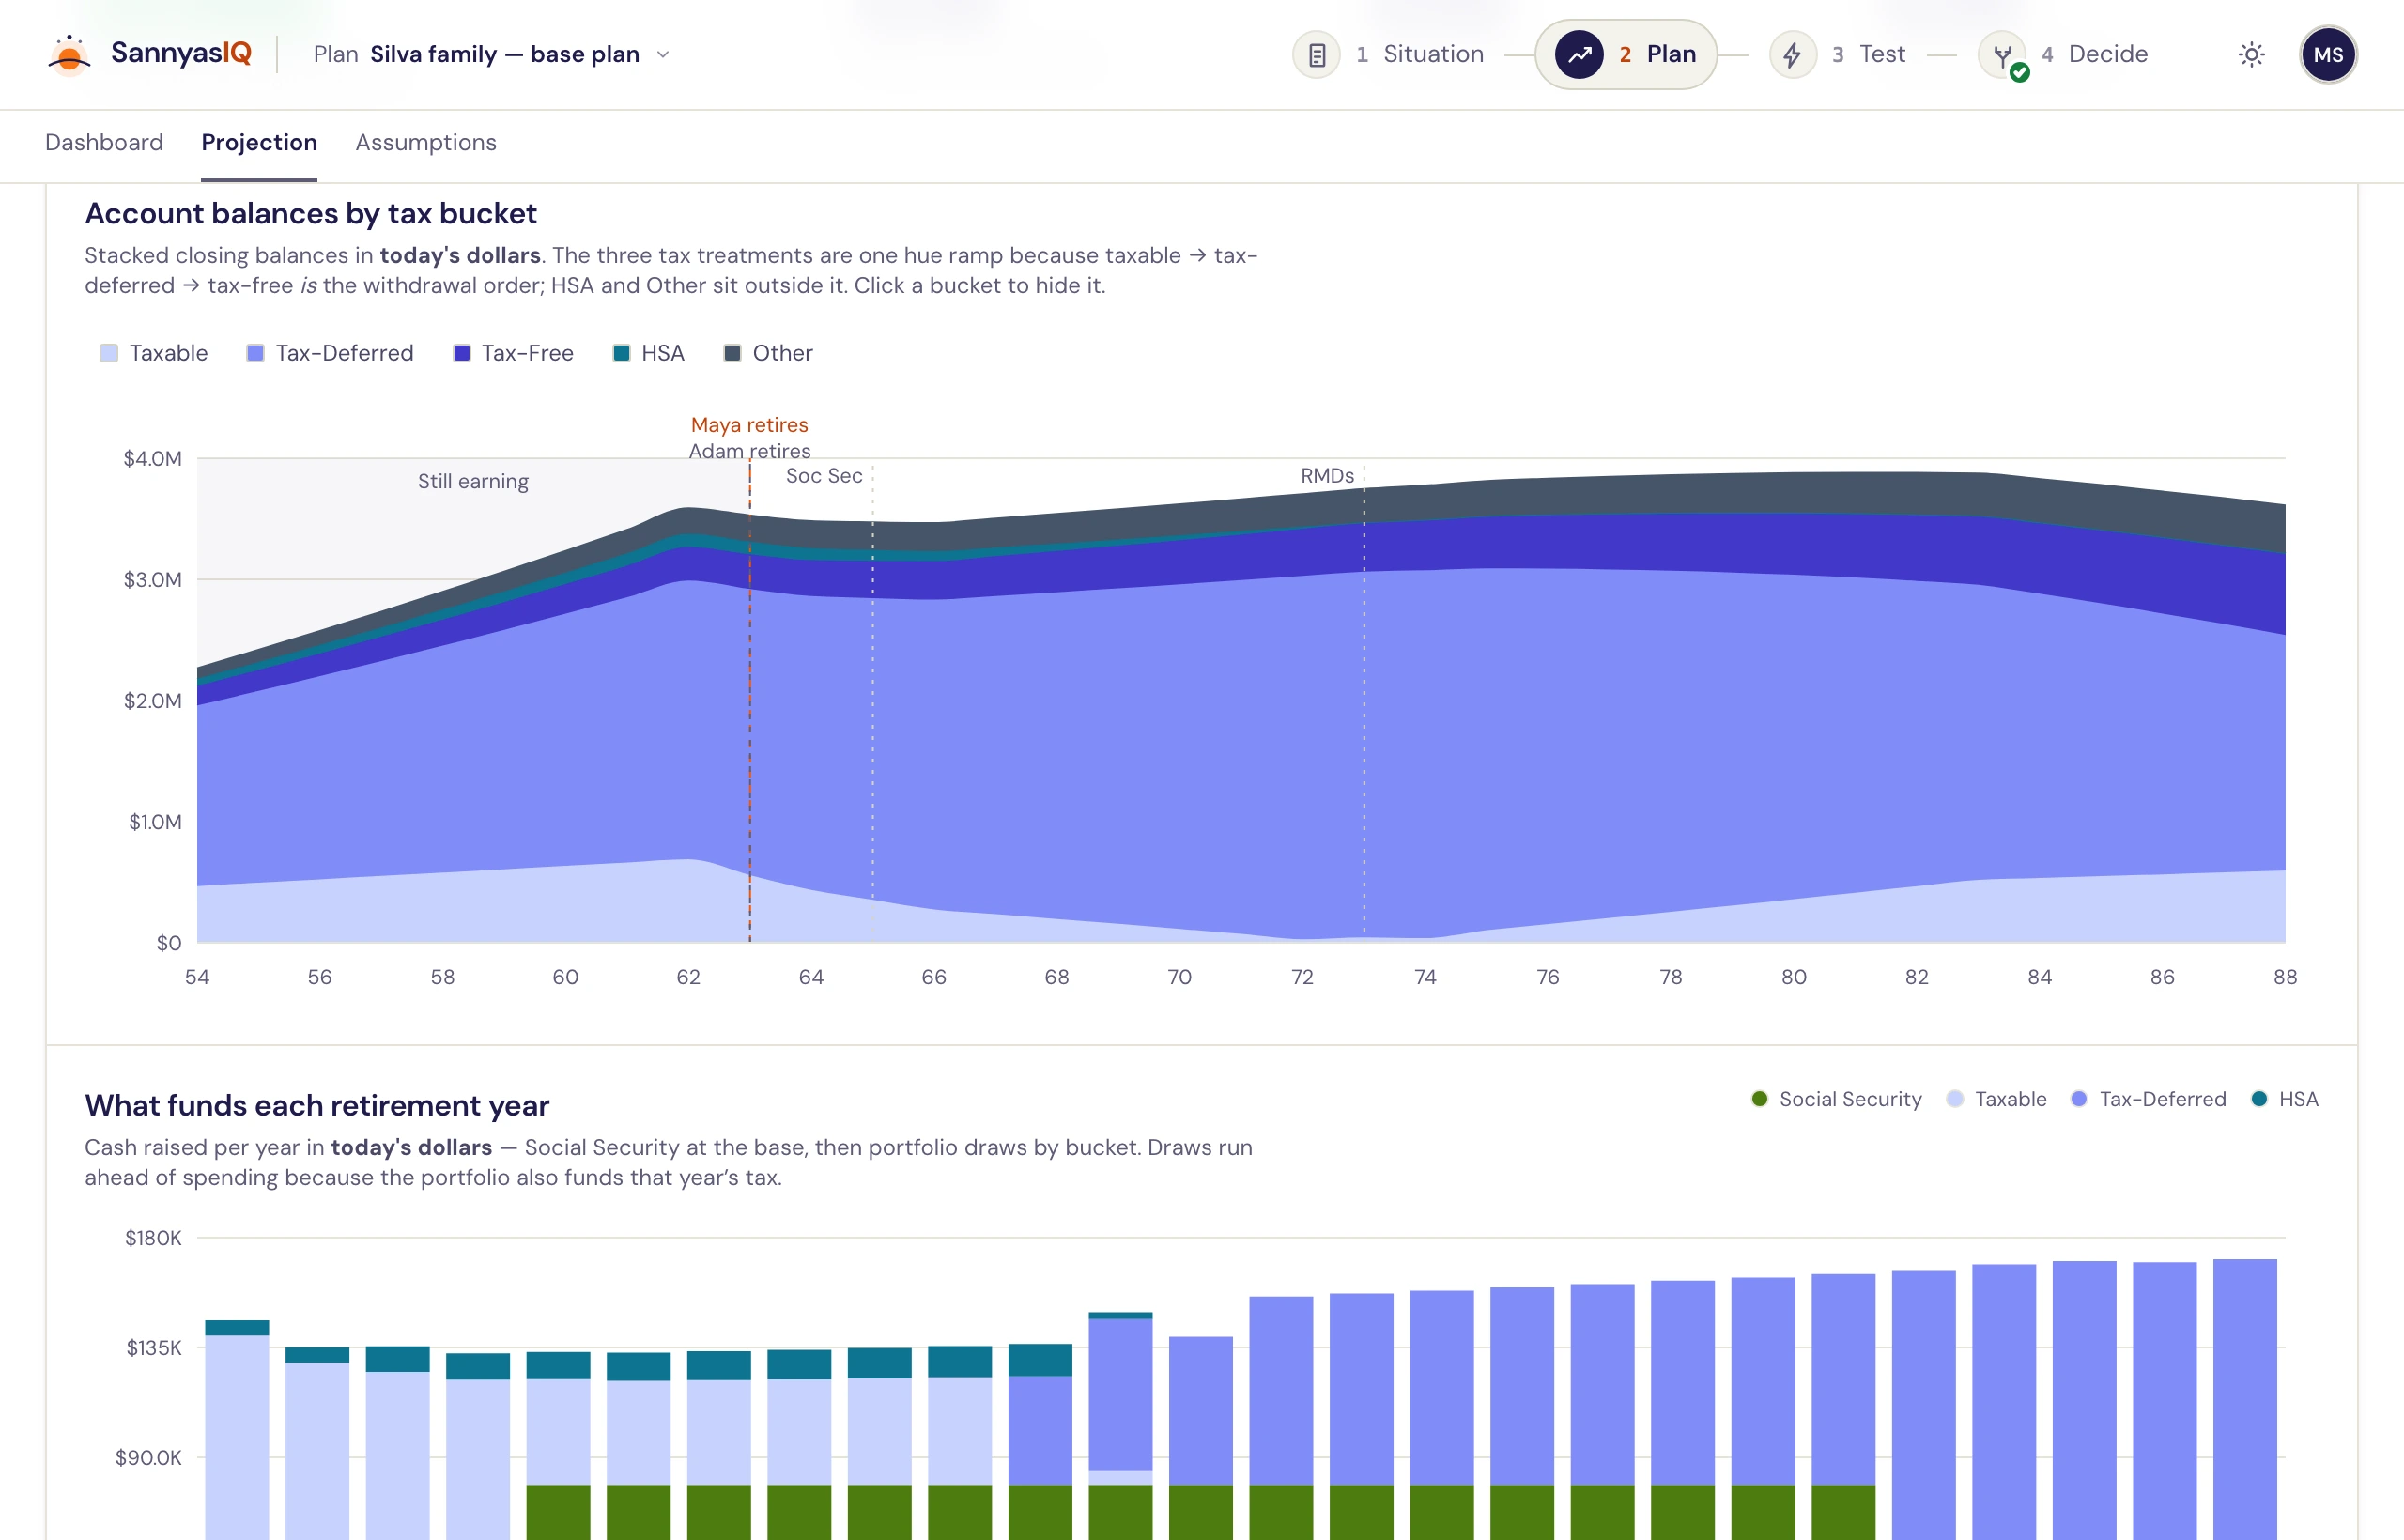
Every stress is measured against your assumptions, so taking 1.5 points off returns means 1.5 off what you assumed — not a flat number that might quietly be an improvement. Returns, inflation, spending and longevity are sliders; specific events are a menu, because a crash in one named year is an event rather than a magnitude.
The menu includes the ones that have actually happened: a −37% crash at retirement, a $150K medical event at 75, a long-term-care episode at 85, and the 1966, 2000–2008, 2008 and 1929 sequences run as real return series rather than as an average.
Which account you spend from first is a tax decision
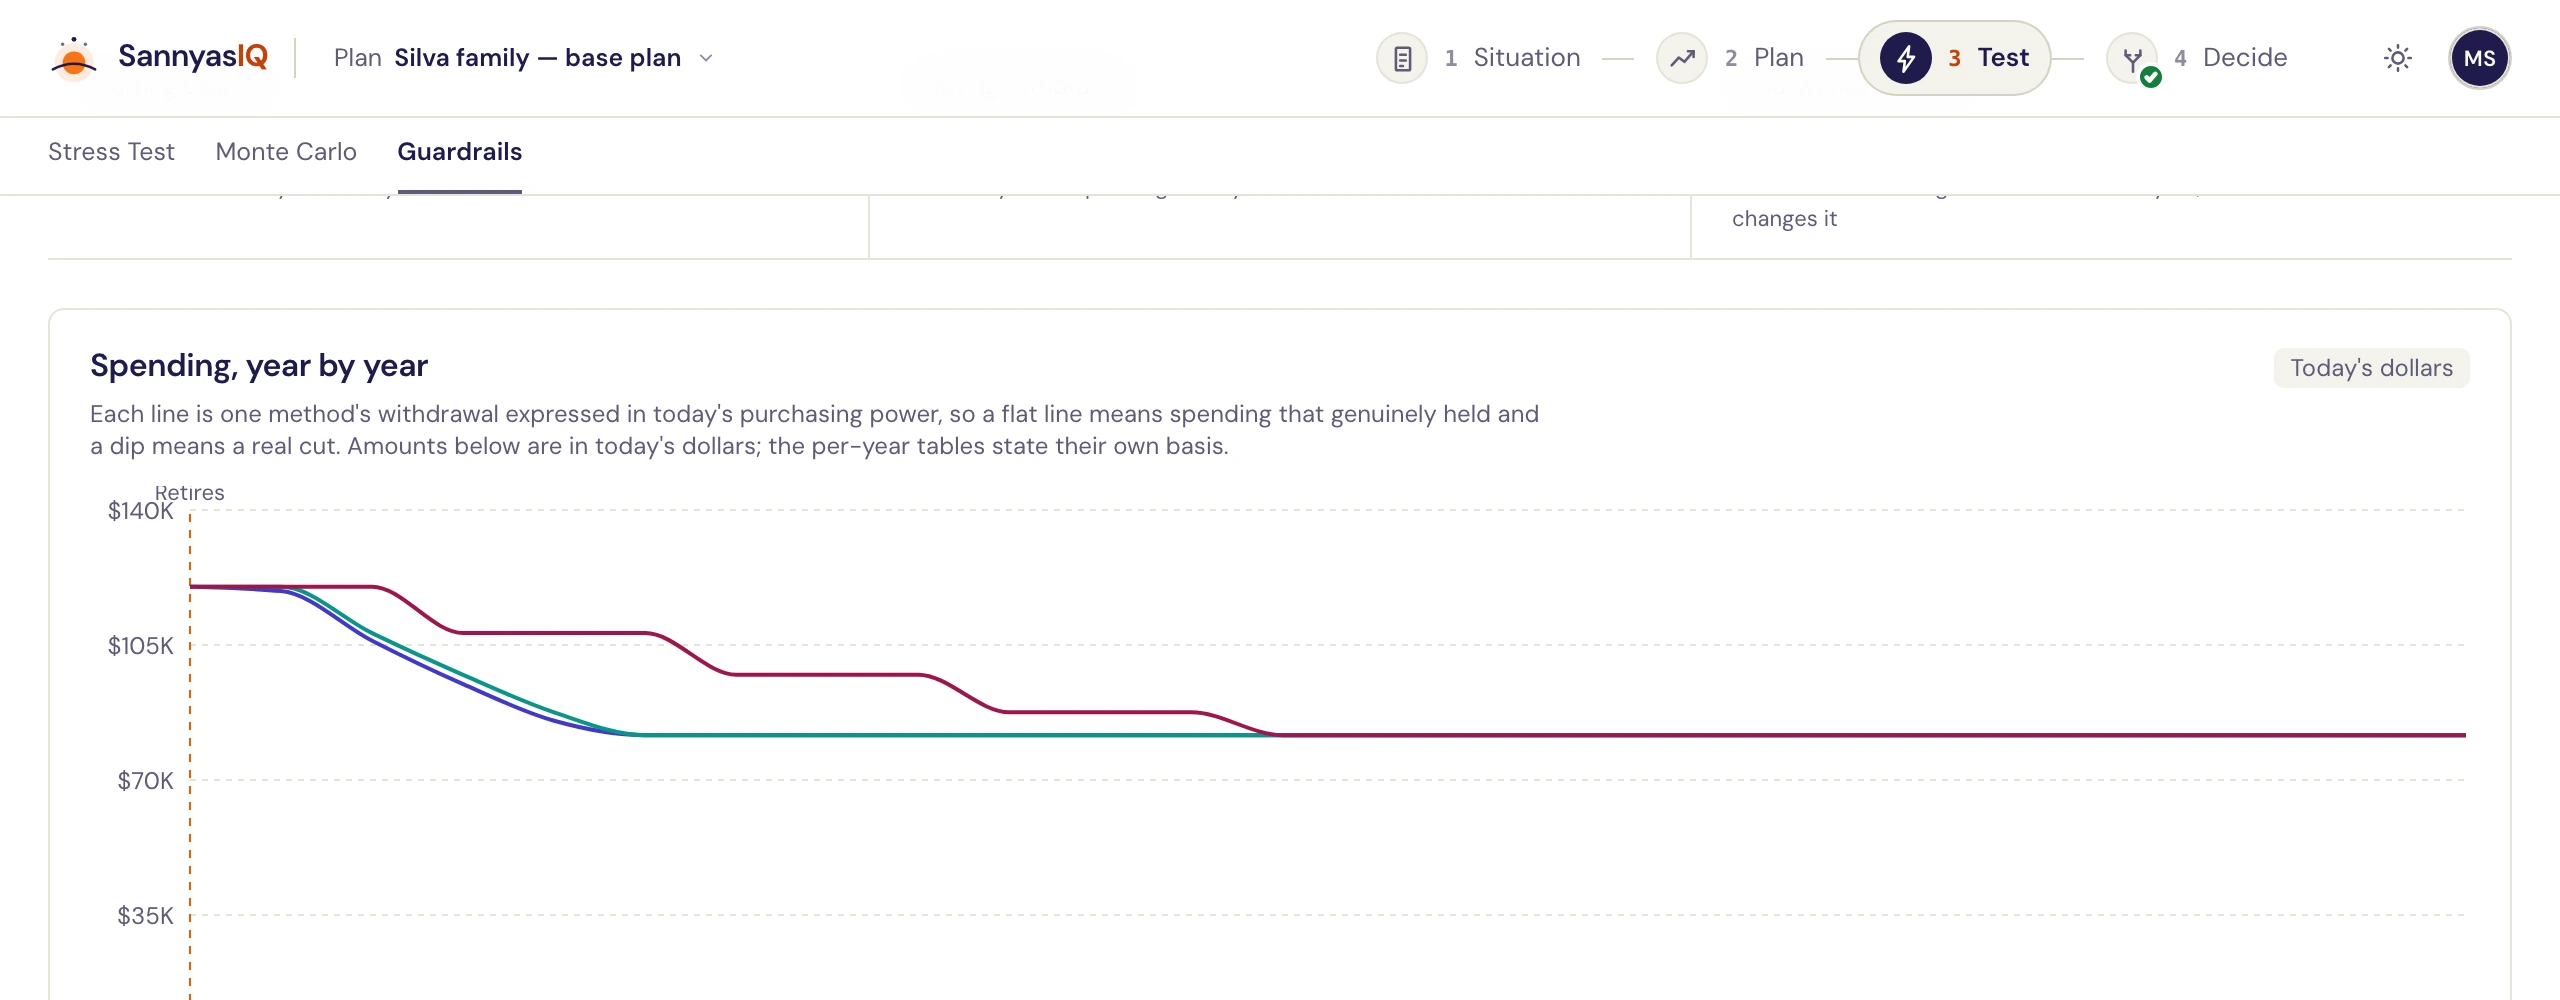
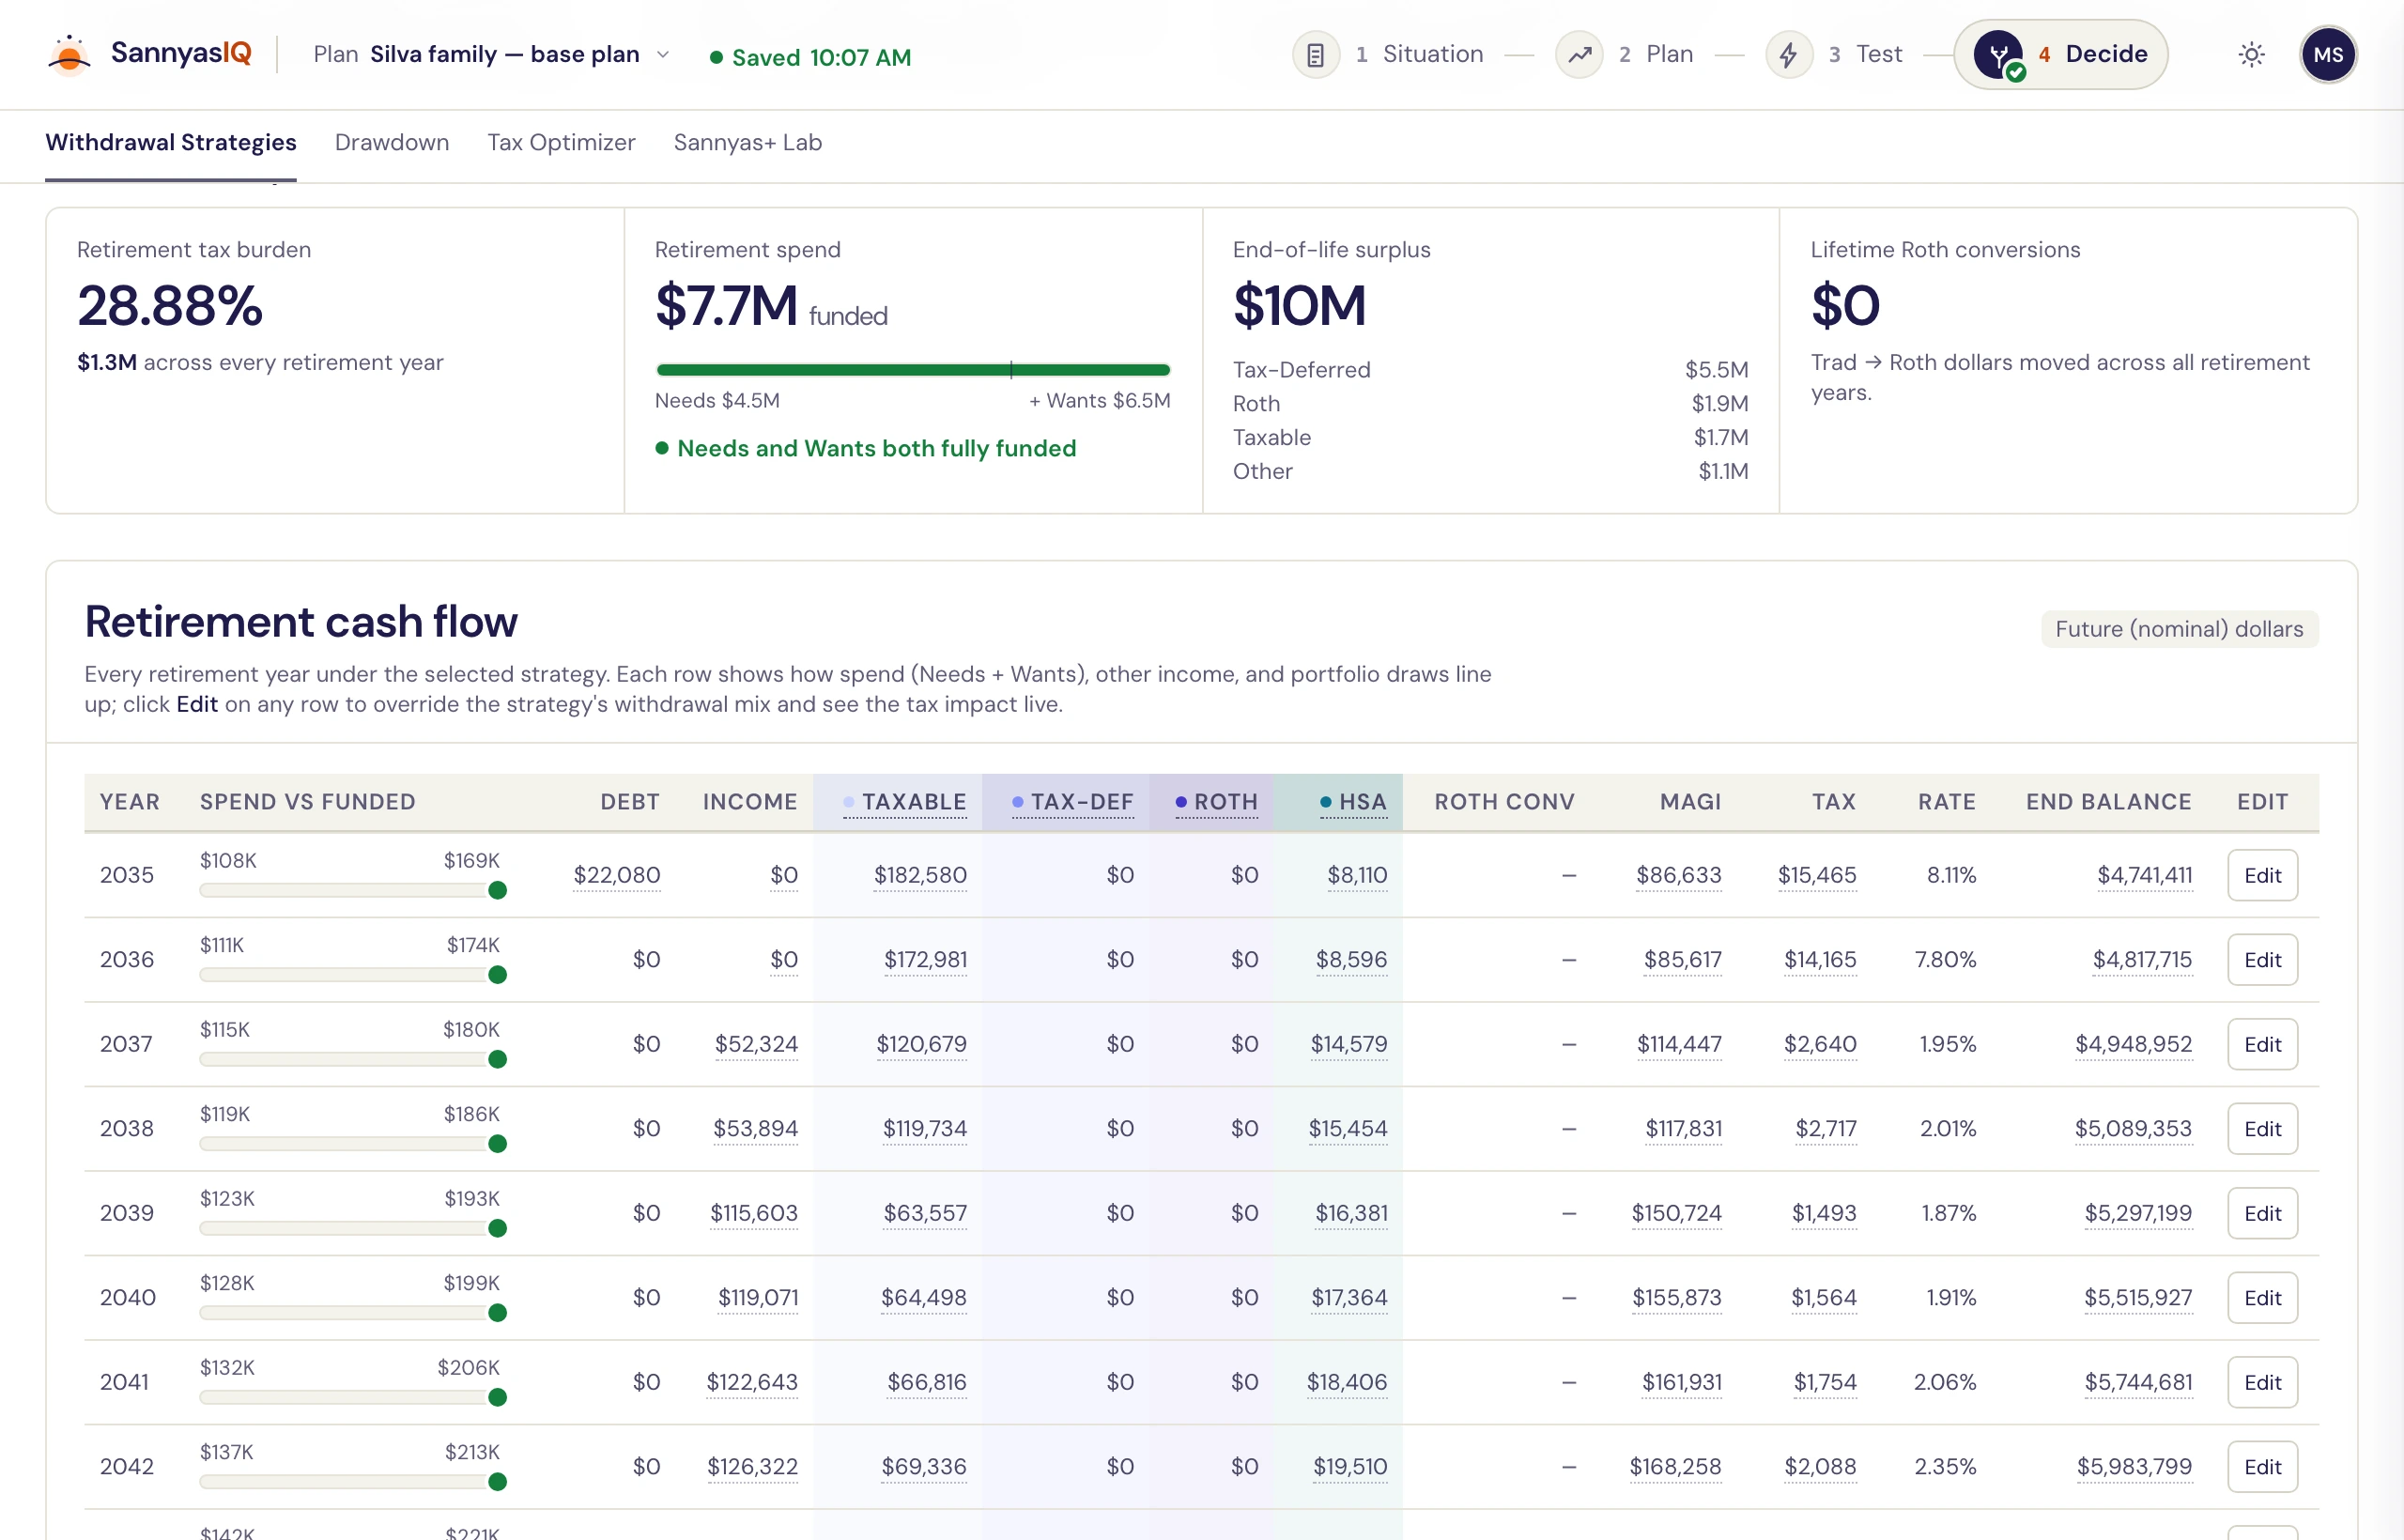
Pick a withdrawal order, layer Roth conversions on top of it to the top of a federal bracket you choose, then override any single year by hand. The tax and the effective rate recompute live, and the setting saves to the plan.
The cash-flow table is the part worth having: every retirement year with its spend against what was funded, the draw from each bucket, the conversion, MAGI, the tax, the effective rate and the closing balance. You can check the engine's work one row at a time.
In the arithmetic
Statute, not vibes.
Tax law is versioned relational data in SannyasIQ, not a table of constants somebody updates by hand each January. The plan is projected against the rules that apply to the year being projected.
Federal + state
Real brackets, and the choice about 2026.
Ordinary income, qualified dividends and long-term gains at current federal and state rates. TCJA is a plan-level assumption you set — permanent, or sunsetting — rather than a decision made for you in a constant somewhere.
SECURE 2.0
Required distributions, by birth year.
RMDs start at 73 or 75 depending on when you were born, and they apply to traditional IRA and 401(k) balances only. Roth accounts and the HSA are exempt for life and stay exempt in the projection.
Healthcare
The pre-Medicare gap, then IRMAA.
ACA premium tax credits before 65, modelled against the income the plan actually produces, then Medicare with its two-year MAGI lookback — so a Roth conversion at 63 shows up as a Part B surcharge at 65, which is where it really lands.
Social Security
Two claimants, three timings each.
Early, full or late, chosen per partner, with the benefit at each. Two earners with different birth years and different retirement dates are the normal case here, not a configuration to work around.
Spending
Needs, wants, and the years in between.
Categories carry their own inflation multiplier — healthcare and travel run hotter than general inflation, which is where a long horizon does its damage. Travel can taper across go-go, slow-go and no-go years, and the needs/wants split is what a stress test cuts first.
One-time expenses
Pegged to a year, an age, or a child.
A kitchen in 2029. A replacement car at 62. Four years of university starting when your daughter turns 18 — pegged to her birthday, so it moves if you correct it and stays put if you remove her.
No black boxes
A plan you can argue with.
A number you cannot interrogate is a number you cannot act on. So every assumption is yours to change, every chart states the dollars it is quoting, and the year-by-year table is always one click away from the summary drawn from it.
When a plan runs dry, SannyasIQ says in which year and what was left. When a spending rule would not have saved it, it says that too — a tool that only ever agrees with you is not measuring anything.
Today's dollars or future dollars, always stated
The engine works in nominal dollars. Every projected figure carries its basis, and one toggle re-expresses a whole page in purchasing power — including the year a plan peaks, which moves when the yardstick does.
Your data is yours
No ad networks, no data brokers, no selling of plans. Export a machine-readable copy whenever you like, and deleting your account deletes it.
A what-if never touches the plan
Simulations run on a deep copy. A branch is a separate plan you can edit and compare side by side, so exploring a worse retirement age cannot overwrite the one you have.