Features
Everything the arithmetic needs — and nothing you cannot inspect.
SannyasIQ is organised the way the work happens: describe your situation, build a plan over it, try to break the plan, then decide how to draw it down. Below is what lives in each phase. See which of it is free.
Situation
Who you are and what you haveEntered once and shared by every plan you build, because your accounts do not change when you ask a different question about them.
Two adults, modelled separately
Birth dates, employment, salaries and raise rates, retirement dates, and a life expectancy per person. Nothing here treats one partner as the household and the other as a modifier.
Dependents, with ages that matter
Children, parents and others. Their birthdays are real dates in the model, which is what lets an expense be pegged to the year one of them turns eighteen.
Accounts with allocation and basis
Checking, savings, CDs, brokerage, traditional and Roth IRA, traditional and Roth 401(k), HSA and 529. Each carries its own equity/fixed/cash split, cost basis and optional return override — so a conservative account does not silently earn the aggressive one’s return.
Contribution limits that know the rules
IRS limits enforced per person and per account type, catch-ups included, with an explicit override when you have a reason to exceed one.
Property, debts and other income
Homes and other assets appreciate; mortgages, auto, student and other debts amortise to their payoff date. Pensions, annuities, rental and royalty income each carry their own taxable share.
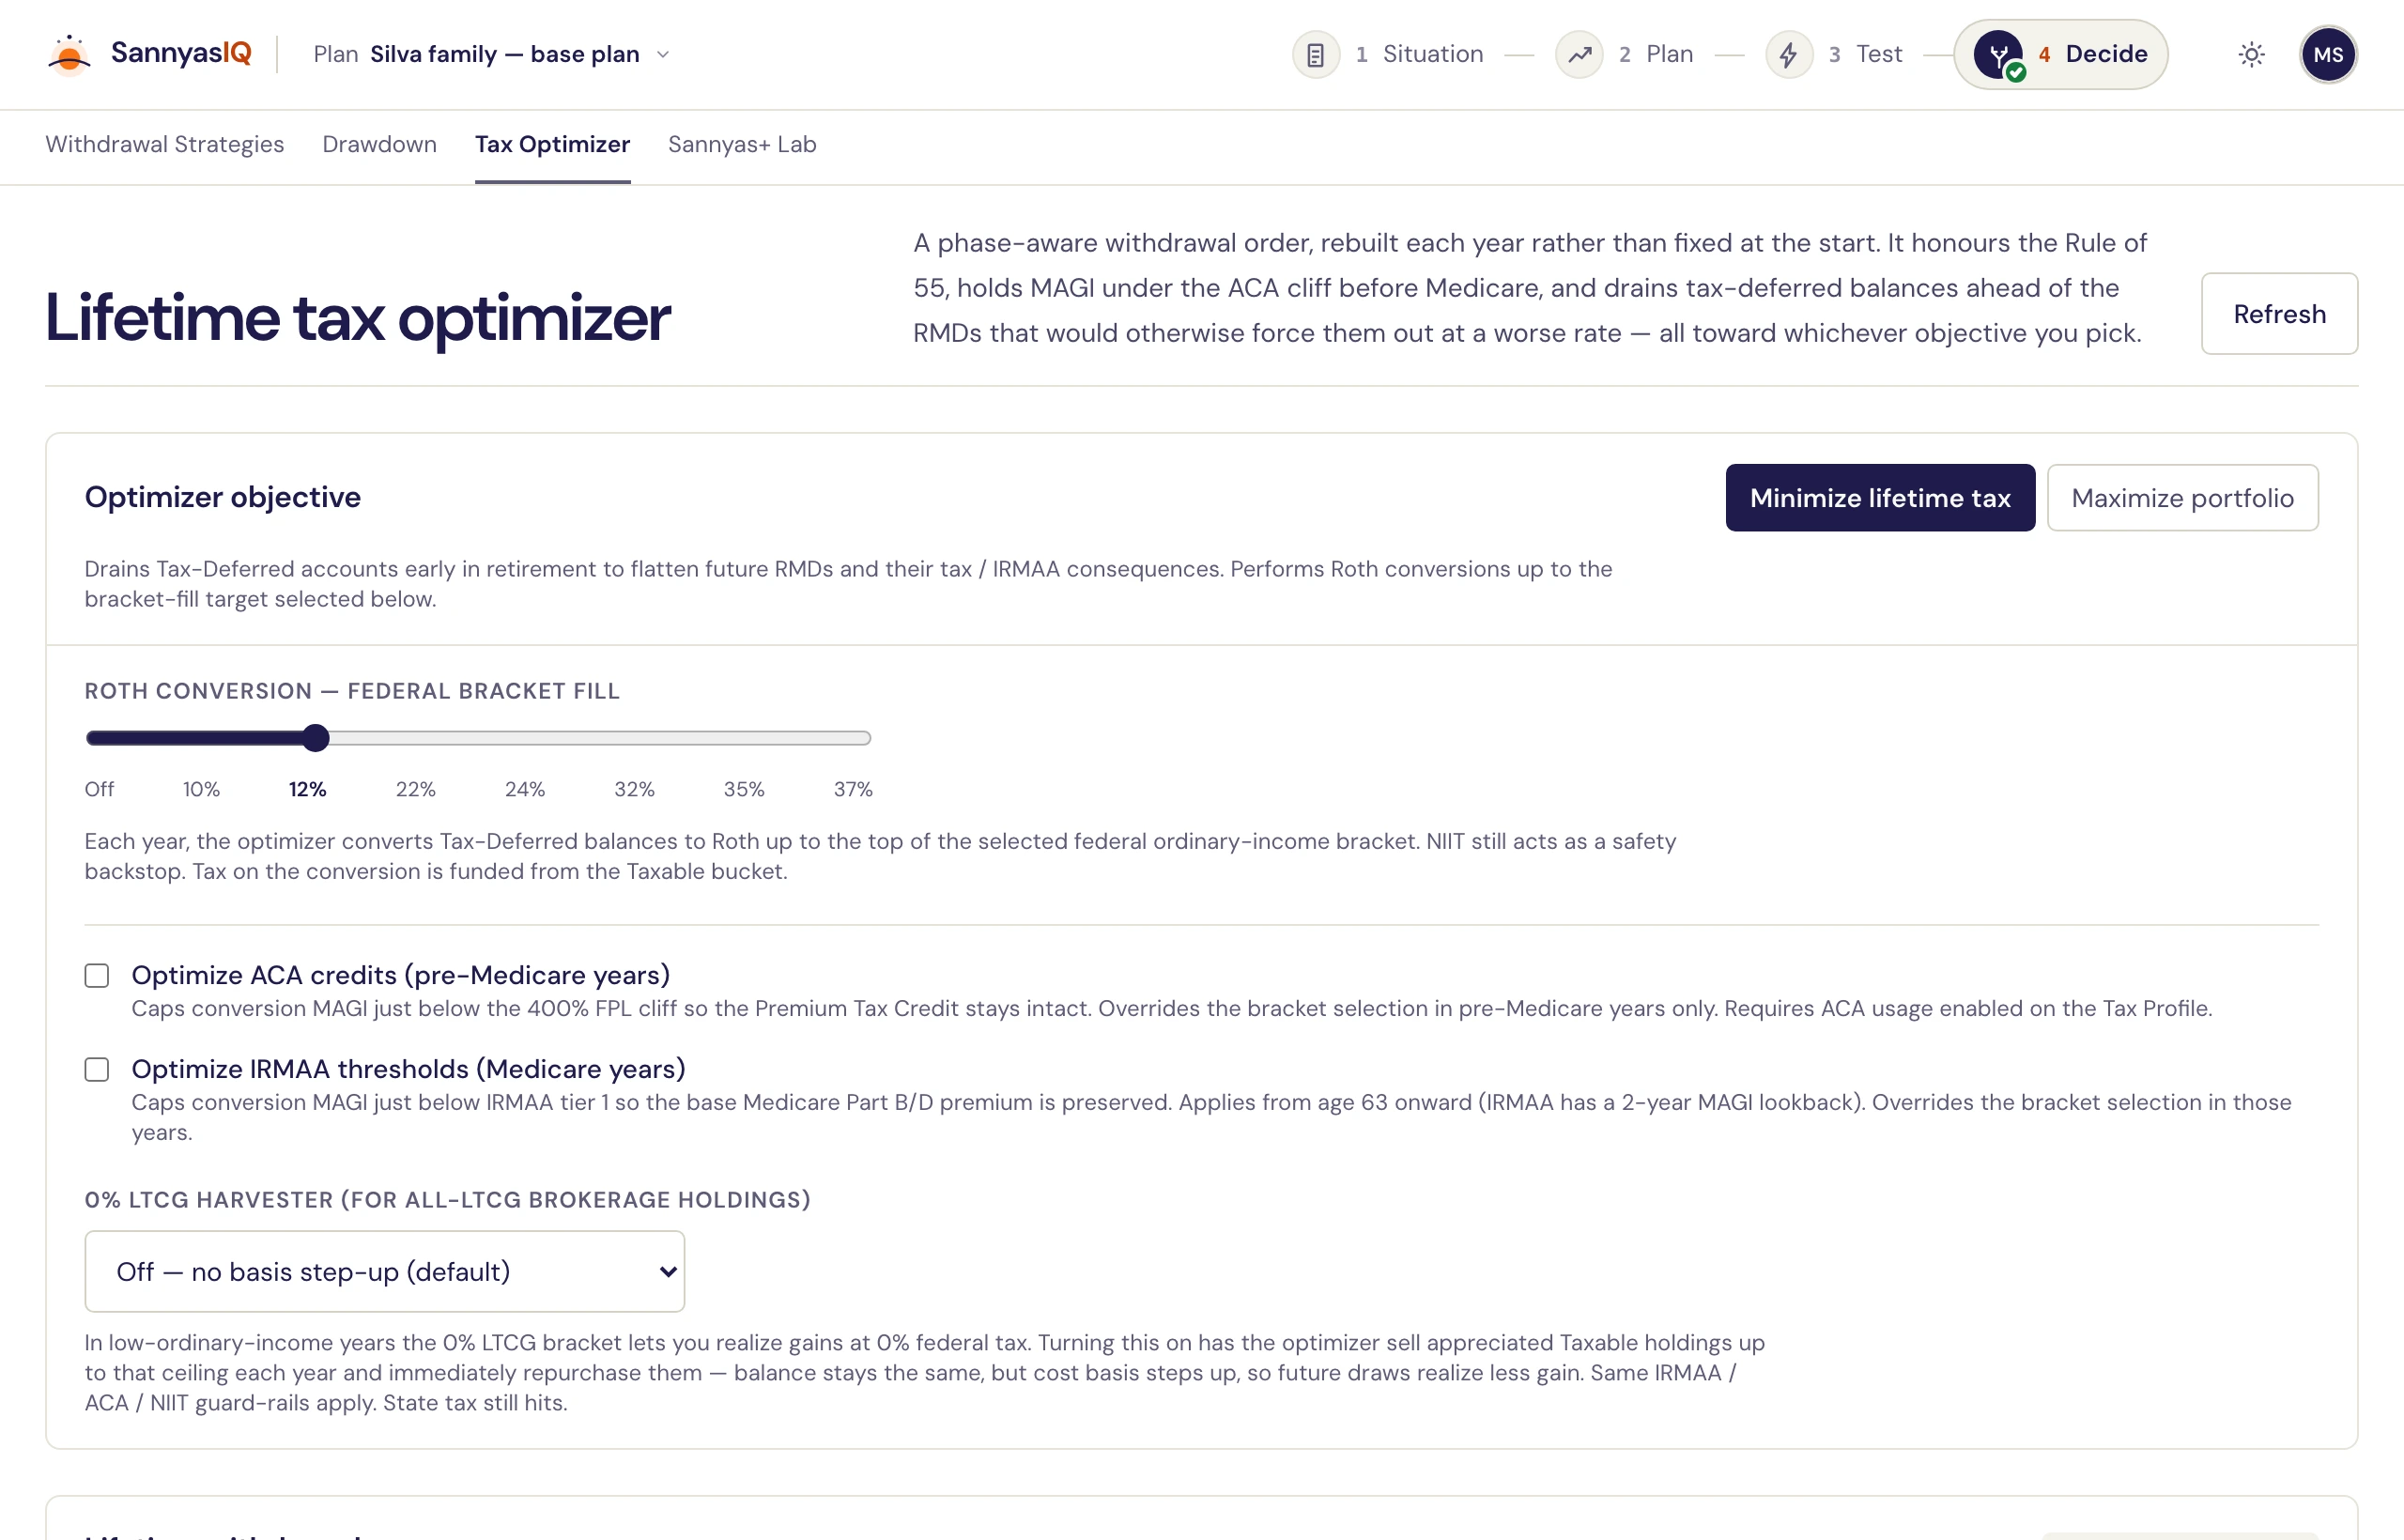
Spending, split into needs and wants
Categories in seven groups, each with its own inflation multiplier and optional age bands. The split is not cosmetic: a stress test cuts wants first, and a guardrail rule may only move wants.
Plan
Build it and see what it doesA plan is a set of levers over your situation. Change one and the projection re-runs — the numbers move while you are still looking at them.
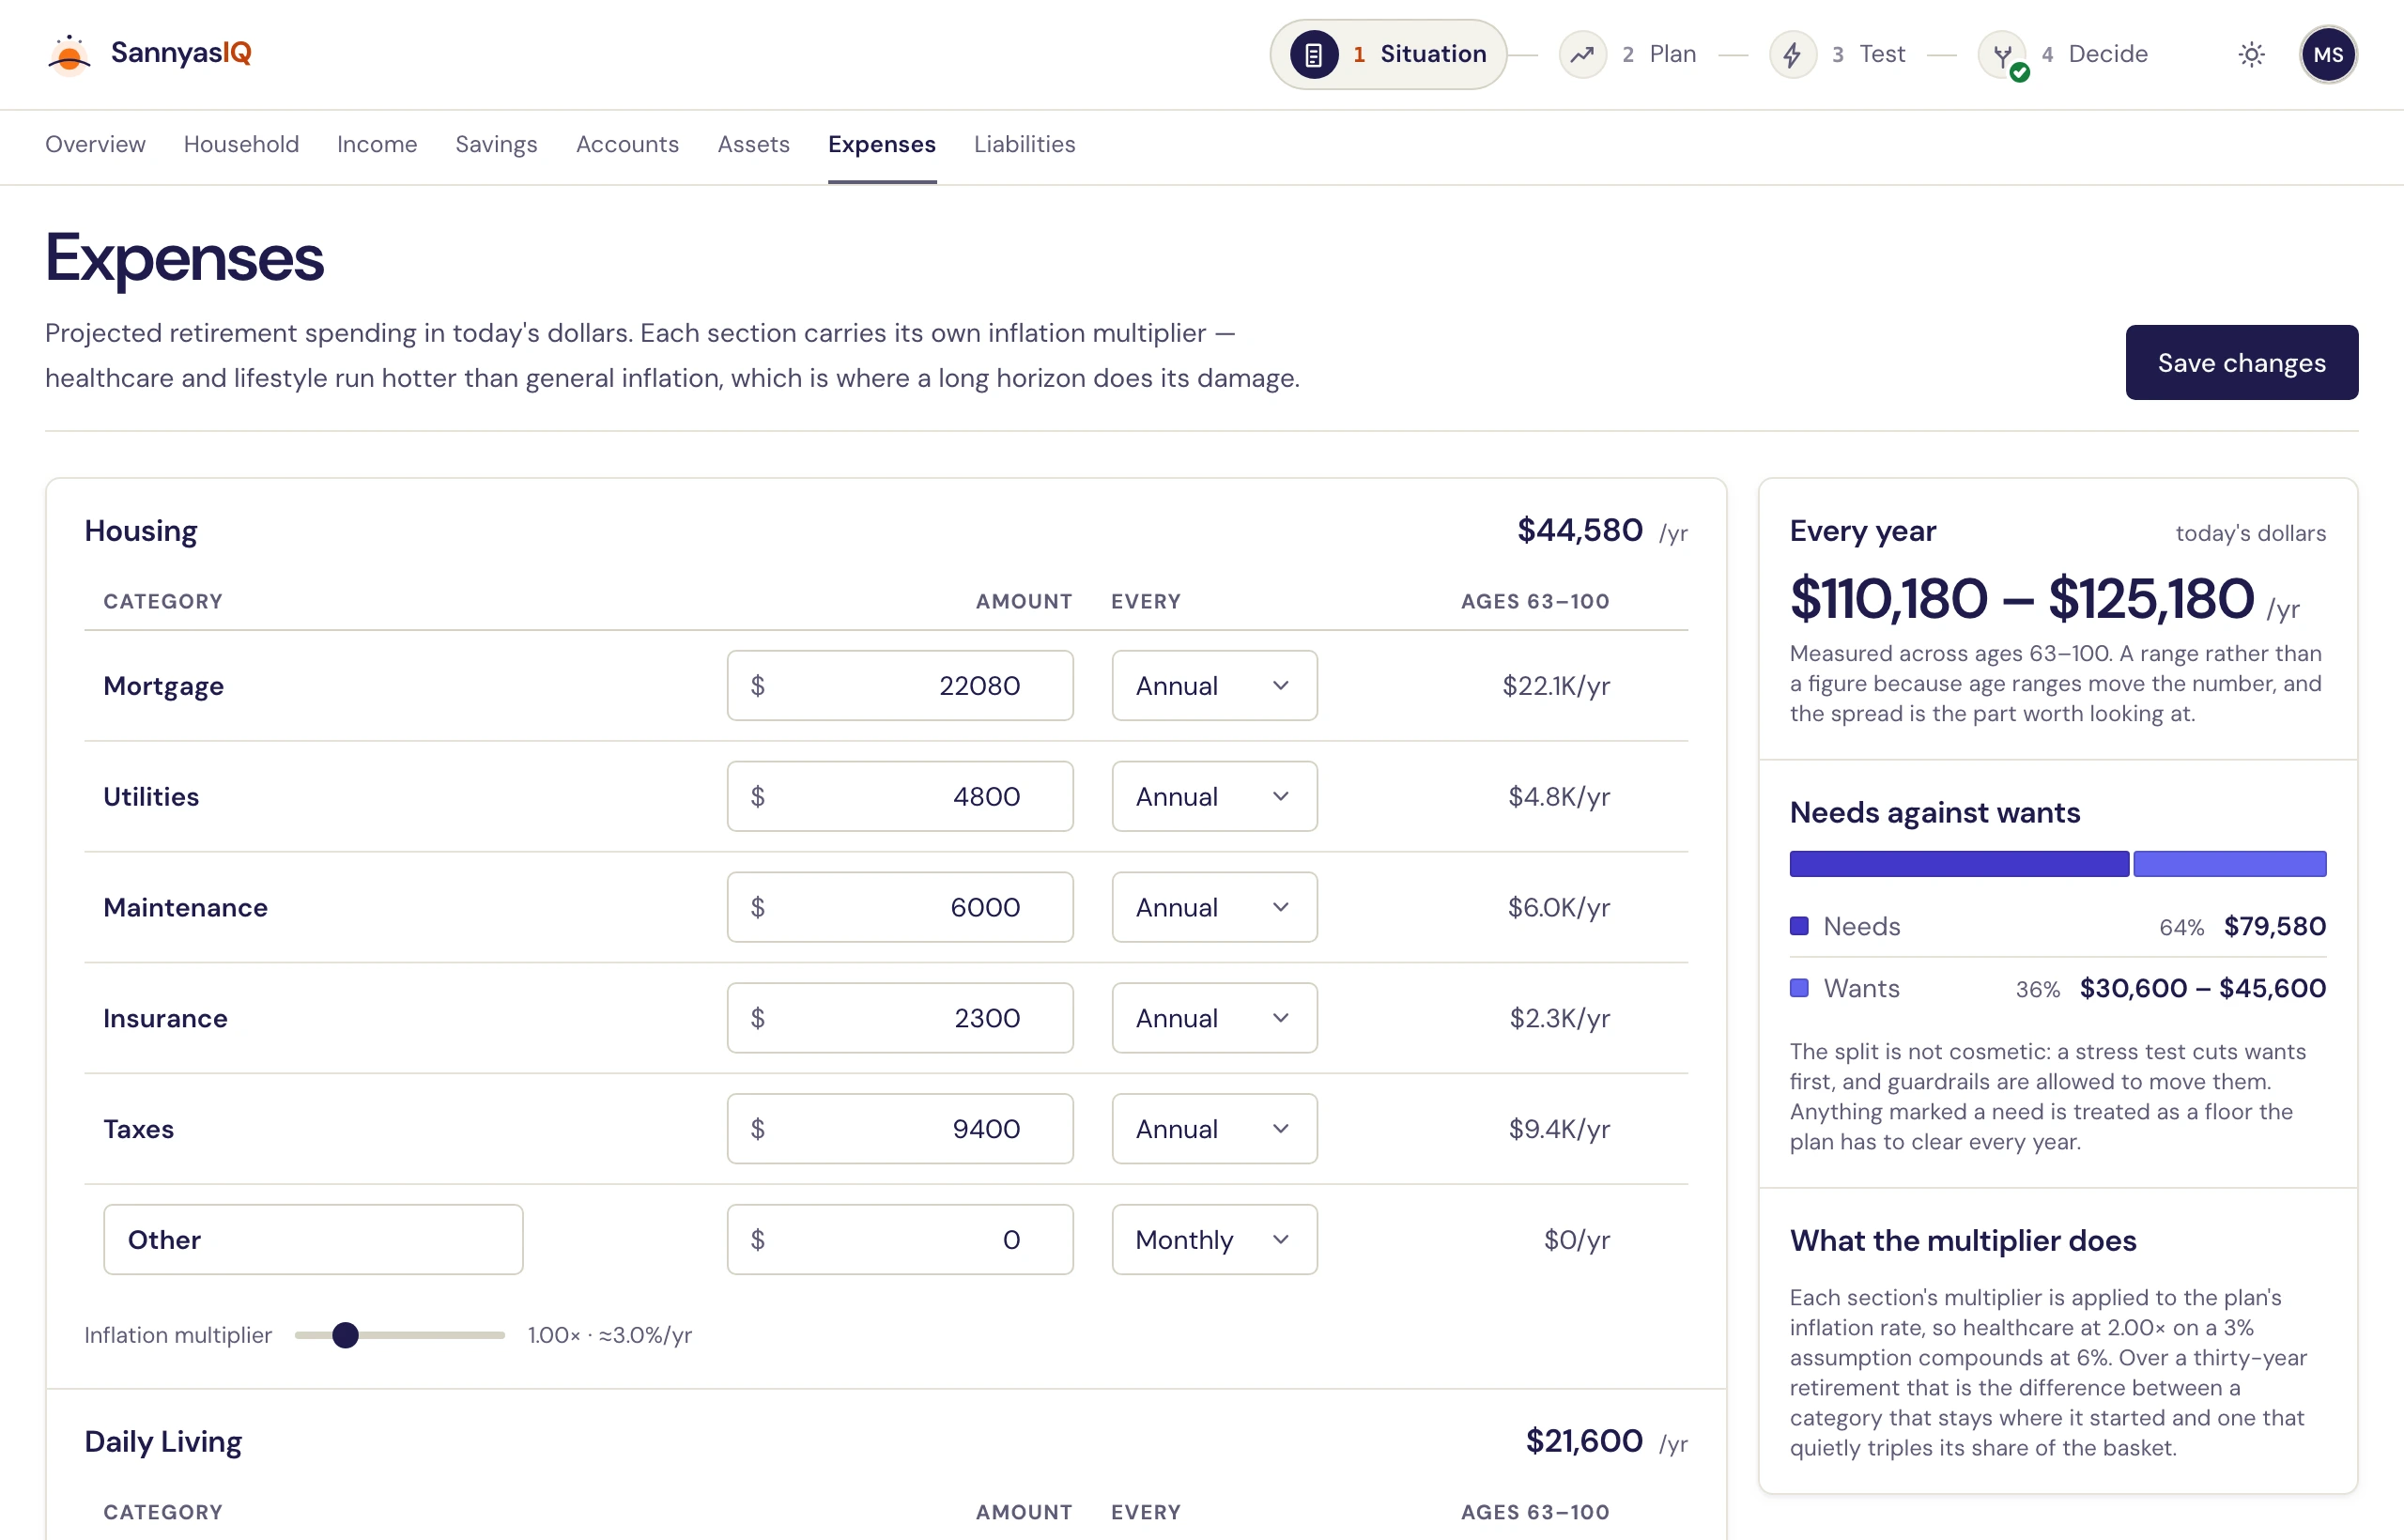
The full projection, four ways
Balances stacked by tax bucket, what funds each retirement year, income against spending, and the year-by-year table the other three are drawn from.
Today’s dollars or future dollars
One toggle re-expresses a whole page in purchasing power. The year a plan peaks moves when the yardstick does, and the page says so rather than quietly changing under you.
Assumptions you own
Inflation, equity, fixed-income and cash returns, healthcare and travel growth multipliers, pre-Medicare and Medicare premium fractions, and whether TCJA is permanent or sunsets.
Life expectancy, estimated then overridden
SSA actuarial tables adjusted for health, exercise, smoking, drinking, BMI, chronic conditions and parental longevity — with the estimate always yours to overrule.
A tax-rules reference that shows its work
The brackets, thresholds, IRMAA tiers, ACA percentages and RMD divisors your plan is being projected against, readable in the app rather than cited in a footnote.
Branch a plan and compare
A what-if is a sibling plan, edited and compared independently. Simulations run on a deep copy, so exploring a worse retirement age cannot overwrite the one you have.
Test
Try to break itA plan that has only ever been run against its own assumptions has not been tested. Three tools, answering three different questions.
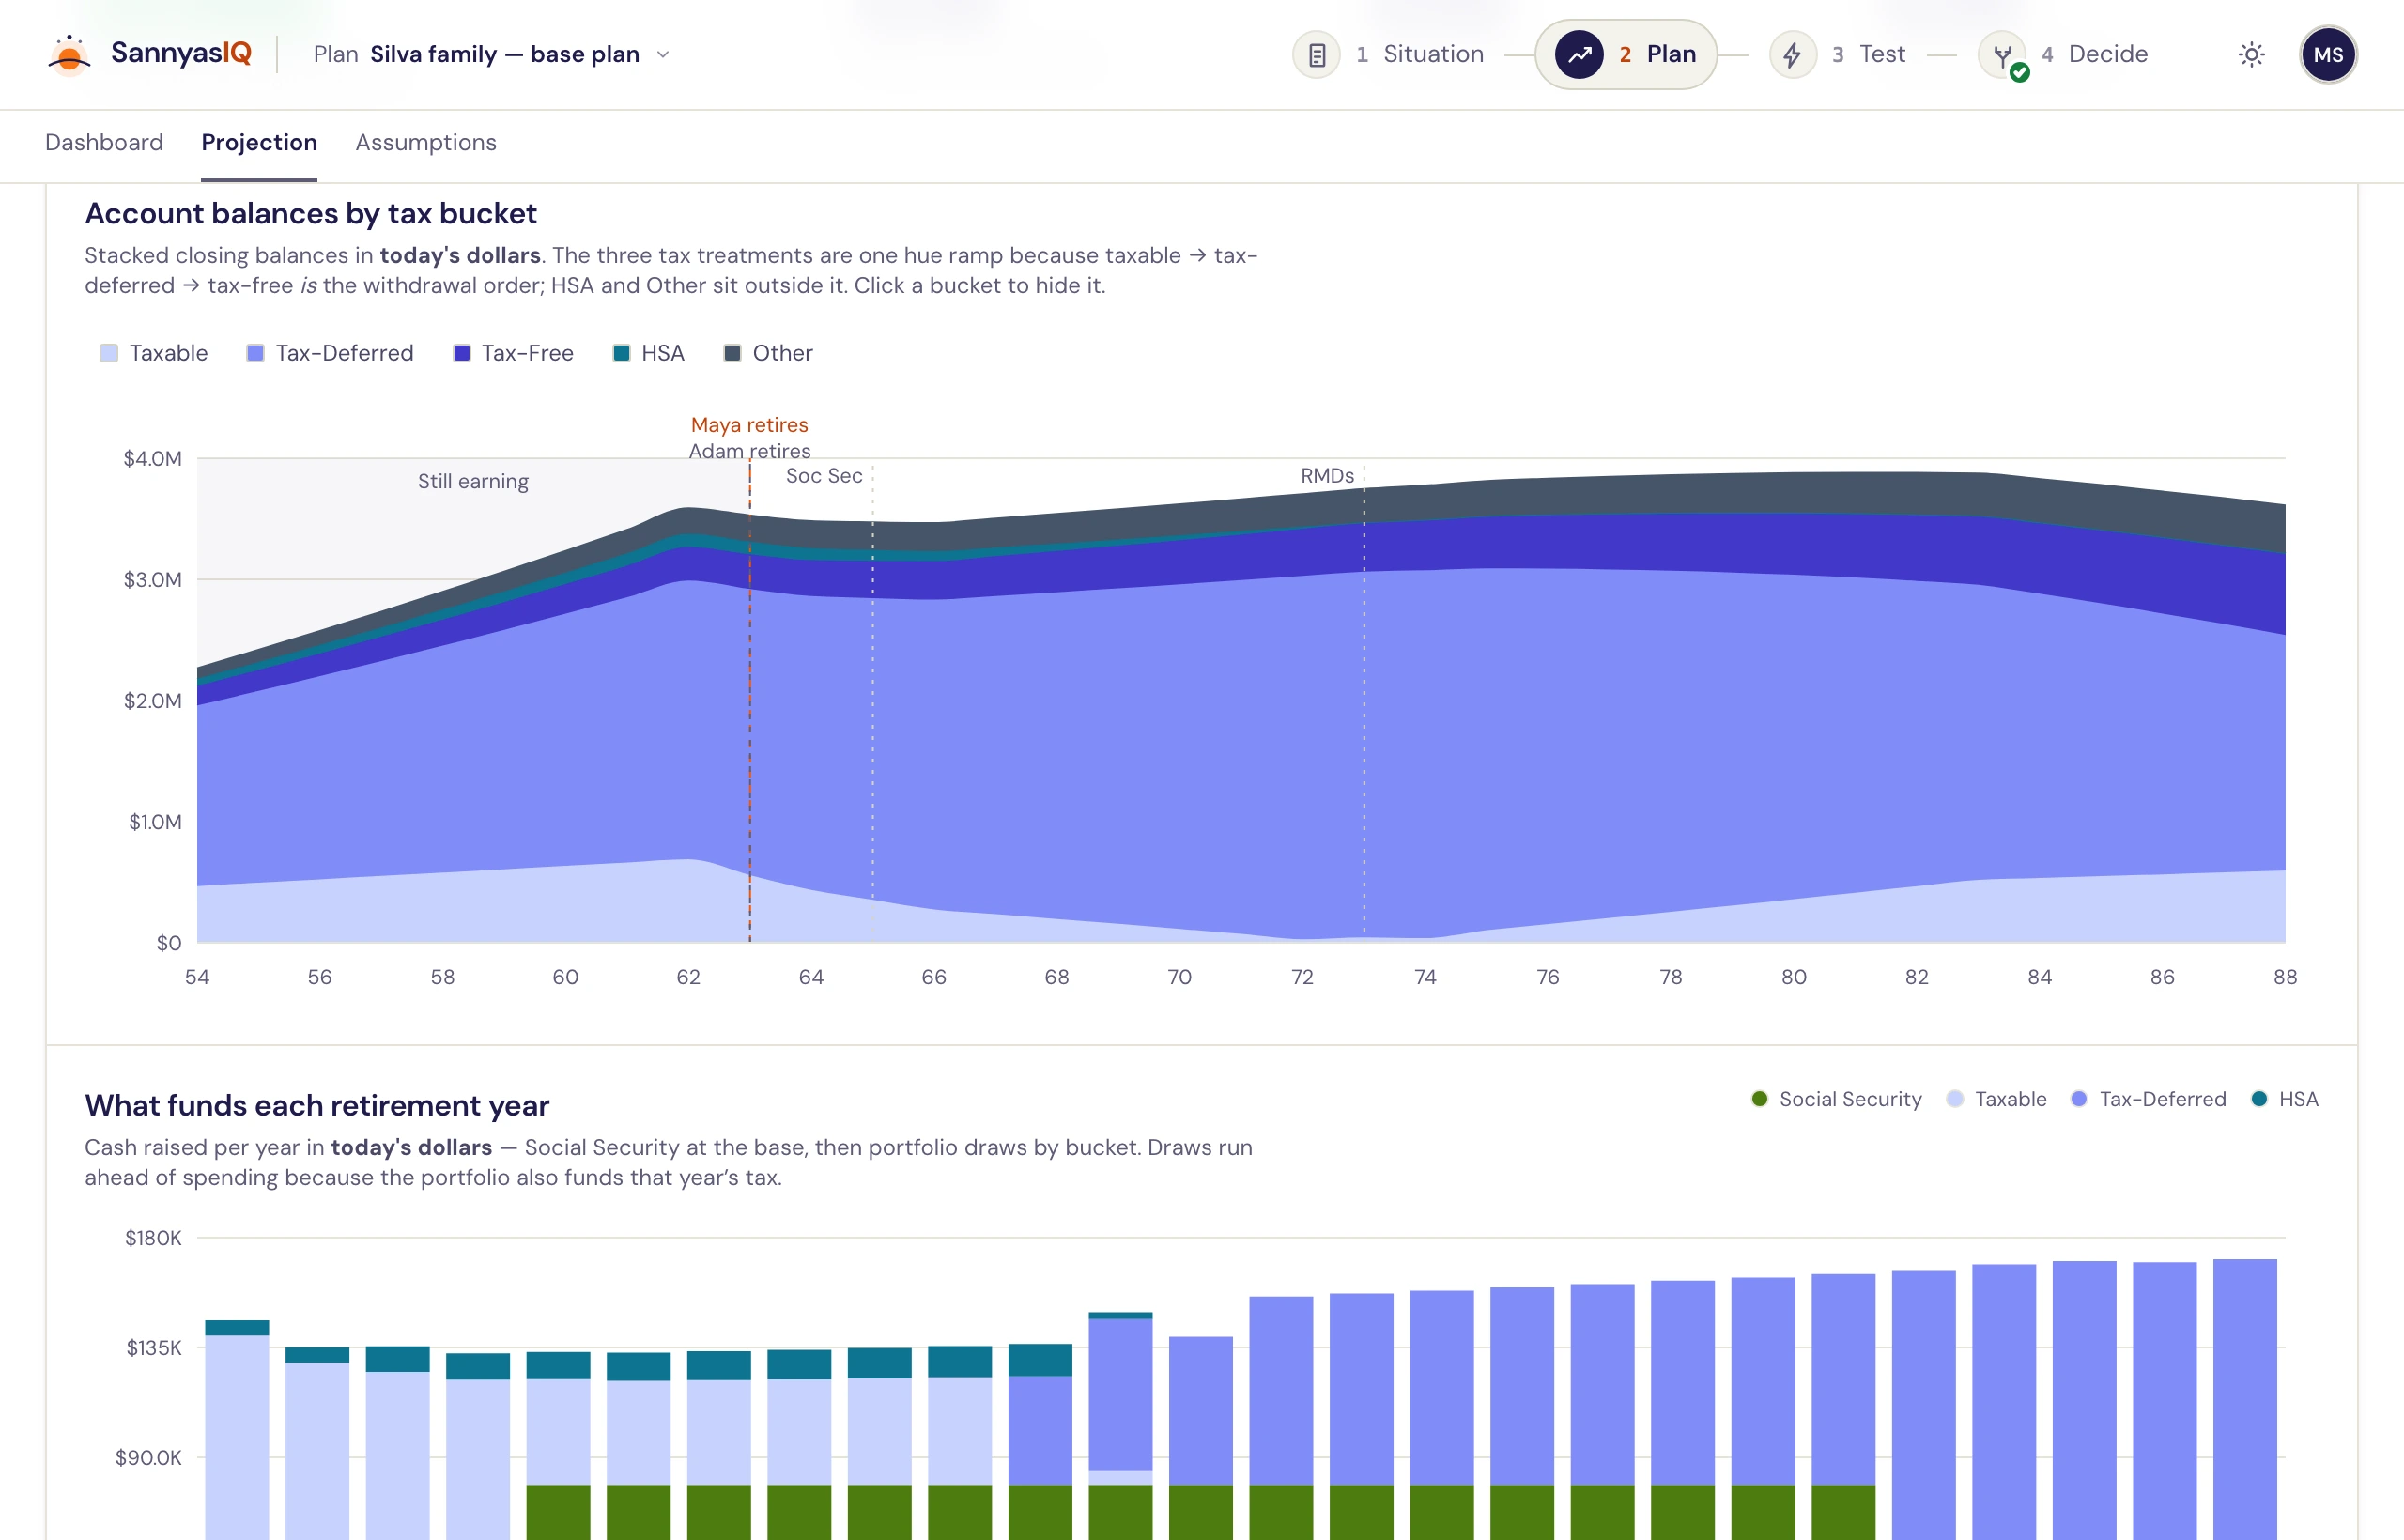
Stress test: how much can go wrong
Returns, inflation, spending and longevity as sliders — each measured against your own assumptions, so a change is always a change relative to what you believed.
Named shocks, not just magnitudes
A −37% crash at retirement, a −30% crash five years in, a $150K medical event at 75, a $250K long-term-care episode at 85 — each labelled with how often something like it has actually happened.
Historical sequences, run as sequences
1966 stagflation, 2000 dot-com plus 2008, 2008 alone, and 1929 — real annual return series threaded through the projection year by year, not averaged into one number.
Monte Carlo, up to 2,000 trials
The whole plan — accounts, expenses, taxes, withdrawal strategy — simulated server-side. You supply volatility, trial count and which extra risks to model.
A score that argues back
Median, 10th and 90th percentile ending wealth, the count that ran dry, and the sequence-risk figure for a bad first decade. Above about 90% the app tells you that you are probably spending less than you could.
Guardrails: what a spending rule would have done
Guyton-Klinger, risk-based and Income Lab compared side by side over a return regime you pick — average spend, worst year, how many times each fired, and what it cost.
Decide
How to actually draw it downThe part most calculators stop before. Which account you spend from first, in which year, and what it costs in tax.
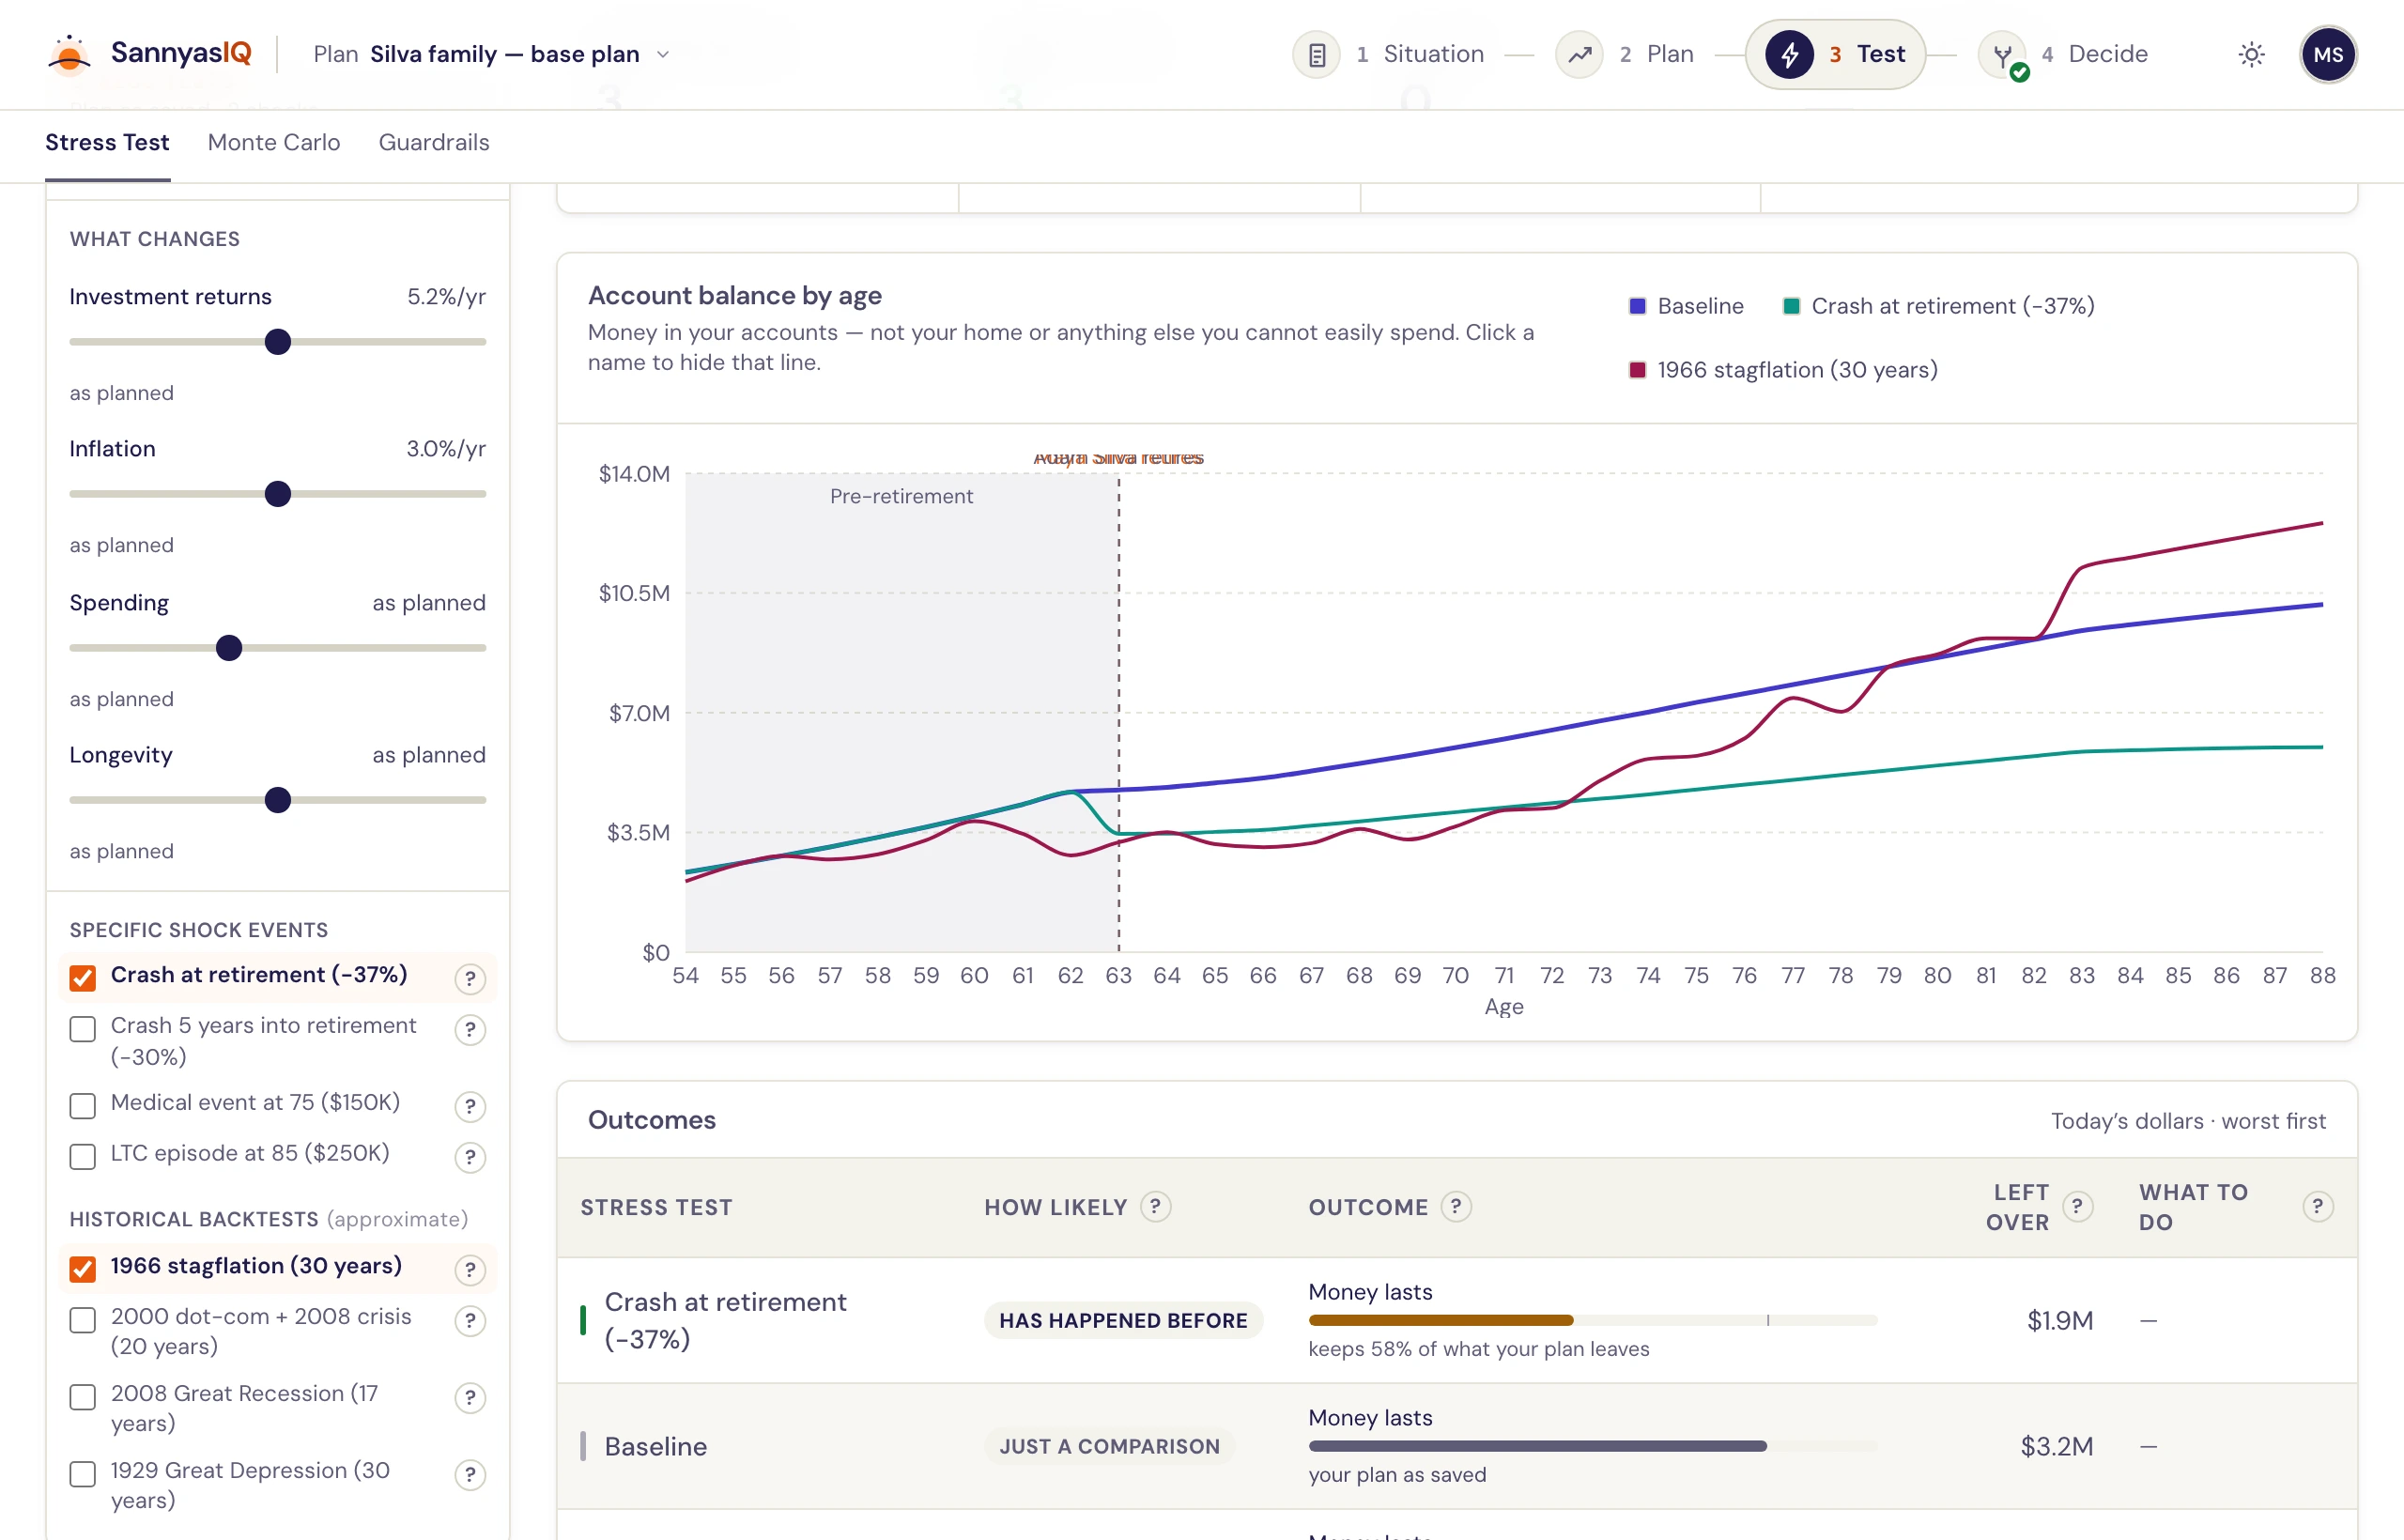
Seven withdrawal orders
Conventional, proportional, Roth-first, tax-free-last, a per-year optimiser, and two needs/wants sweeps — one of which preserves Roth. Switch and the projection updates instantly.
Roth conversions to a bracket you choose
Fill to the top of the 10, 12, 22, 24, 32, 35 or 37% federal bracket each year. Conversion tax is funded from the taxable bucket, and NIIT still acts as a backstop.
Keep MAGI under the cliffs
Cap conversions just under the 400% FPL line so the ACA premium credit survives, and just under IRMAA tier 1 from age 63 — because IRMAA looks back two years and that is when it starts to matter.
0% long-term-gain harvesting
In low-income years, realise gains at 0% federal and repurchase immediately. The balance does not move; the cost basis steps up, so later draws realise less gain.
Refuse to spend from an account
Fence off a whole account, a dollar floor, or a share of its balance. Every site that sizes a draw reads through the fence — the two deliberate exceptions being RMDs, which are statute, and run-out detection, which asks about reachable money.
Override any single year by hand
Take the strategy’s mix for one year and change it. The tax, the effective rate and the closing balance recompute live, and the override saves to the plan.